Experiment: simple pendulum and loss of energy
Beyond NCERT In the JEE Main and NEET syllabus; the Class 11 book has no section for it.
Quick answer
Time several complete small oscillations to find the pendulum period, and record successive turning-point amplitudes as the motion decays. Because small-angle energy is proportional to A, plotting A against time tracks relative energy loss. An exponential trend is a model to test; timing uncertainty must include reaction and measurement errors.
What is this experiment?
The principle behind it
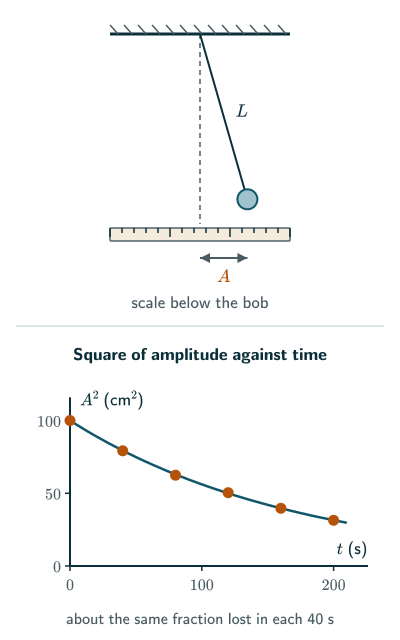
A simple pendulum making small swings has a period T = 2π√(L/g) and an energy proportional to the square of its amplitude A. Timing many swings gives T. Reading the amplitude at regular intervals as the swings die away, and plotting A against time, shows how the pendulum’s energy is dissipated by air resistance and by friction at the support.
In practice, oscillating bodies eventually come to rest at their equilibrium positions because of the damping due to friction and other dissipative causes.
NCERT Physics Part II (Class 11), Section 13.2, page 260
Both the JEE Main 2027 and the NEET (UG) 2026 syllabuses list this under Unit 20, Experimental Skills: “Simple pendulum-dissipation of energy by plotting a graph between the square of amplitude and time”. The NCERT textbook derives the period (Section 13.8); NCERT’s Class XI Physics Laboratory Manual gives the method in Experiment 6 (pages 60–67) and Activity 7 (pages 148–151). This page adapts those methods in two parts: measuring the time period, and following the square of the amplitude with time.
Apparatus
- A heavy metal bob with a hook, on a light, inextensible thread about 1 m long.
- A rigid clamp stand with a split cork, so that the thread swings from a fixed point.
- A stopwatch reading to 0.1 s (or better); a balance if absolute energy, rather than only relative energy loss, is required.
- A metre scale, to measure the length, and a half-metre scale fixed horizontally just below the bob, centred on its rest position, to read the amplitude.
- Vernier callipers, to measure the diameter of the bob.
Theory
Period. For small swings the motion is simple harmonic with T = 2π√(L/g) (NCERT Eq. 13.26, Section 13.8; see the derivation for the simple pendulum). Here L is the effective length, from the point of suspension to the centre of the bob: include the hook and bob radius according to the points used when measuring the thread. Rearranging, g = 4πL/T.
Energy. A simple harmonic oscillator has total energy E = ½mωA, where A is its amplitude (NCERT Eq. 13.18 with k = mω). For a pendulum ω = g/L, so for small swings, with A the sideways displacement of the bob,
Energy of a pendulum
For a given pendulum, m, g and L are fixed, so the energy is proportional to A. A graph of A against time is therefore a graph of the energy against time, up to a constant factor. (The same result follows from E = mgh, since the bob rises by h ≈ A/(2L) at the end of each swing.)
Why the energy falls. Air resistance on the bob and thread, and friction at the point of suspension, do negative work on every swing, so the mechanical energy is not conserved: it is turned into heat. The simplest model (beyond the NCERT text) takes the drag as proportional to the speed, like viscous drag. For small underdamped oscillations with linear drag, successive turning-point amplitudes follow an exponential envelope. Their squared values, and hence turning-point energies, fall by the same fraction over equal numbers of cycles. Plot ln(A/A) against time to test this; instantaneous energy need not be an exact pure exponential within a cycle. For a bob a few centimetres across, moving at tens of centimetres per second, real air drag grows faster than the speed (closer to v), so a real A–t curve falls steeply at first and more gently later but need not be exactly exponential.
Part 1: measuring the time period
- Measure the length of the thread from the point of suspension to the hook, and the diameter of the bob with vernier callipers. L = thread length + hook length + radius of the bob.
- Fix a mark (a vertical line or the rest position on the scale) behind the bob when it hangs at rest.
- Pull the bob aside by a small amount, about 5 cm for a 1 m pendulum (a few degrees), and release it without pushing, so it swings in one plane.
- Start the stopwatch as the bob passes the mean position, and count the oscillations, starting the count at zero. Count each return through the mark in the same direction as one complete oscillation, and stop after 20 (or more).
- Repeat and take the mean time t. The period is T = t/20.
- Repeat for several lengths. A graph of L against T is a straight line through the origin with slope g/4π. If you plot the thread length alone, forgetting the radius r of the bob, a constant omitted length δ (bob radius plus any unmeasured hook) shifts the length-axis intercept to −δ without changing the ideal slope. Fit an intercept rather than forcing the line through zero; length-dependent errors can still bias the slope. This is one reason to find g from the slope.
Why time many oscillations? If the absolute start/stop timing uncertainty is similar for both runs, dividing a 20-cycle time by 20 reduces its contribution to the uncertainty of T by a factor of 20 (Example 1).
Part 2: square of the amplitude against time
- Fix the half-metre scale horizontally just below the bob, with its middle under the rest position.
- Release the bob gently and let a few swings settle into one plane. At a chosen turning point, record the initial amplitude (for example 10 cm) and set that time as zero.
- Every chosen number of complete oscillations, read the turning-point displacement on the same side and record its time. NCERT suggests every 5 or 10 cycles; the illustrative table below uses 20.
- Continue until the amplitude is too small to read well.
- Tabulate t, A and A, and plot A against t.
A sample observation table (illustrative values, used in Example 2; L = 1.0 m, T ≈ 2.0 s):
| t (s) | A (cm) | A (cm) |
|---|---|---|
| 0 | 10.0 | 100 |
| 40 | 8.9 | 79.2 |
| 80 | 7.9 | 62.4 |
| 120 | 7.1 | 50.4 |
| 160 | 6.3 | 39.7 |
| 200 | 5.6 | 31.4 |
Result. The graph of A against t is a curve that falls steadily: the energy of the pendulum decreases with time. In these illustrative values it falls by about the same fraction (to about 0.79 of its value) in every 40 s; the amplitude data alone cannot identify whether air drag, support friction or other losses dominate.
Precautions. Use a heavy, compact bob, so that air resistance has little effect, and a light, inextensible thread, so that its mass can be ignored and the length stays fixed. Clamp the thread firmly between the halves of a split cork, so the point of suspension does not move. Keep the amplitude small, so the motion is simple harmonic. Release the bob without a push, and make sure it swings in a plane and does not spin or move in an ellipse. Read the amplitude with your eye directly above the bob to avoid parallax, and keep draughts away. Count oscillations from the mean position, where the bob moves fastest and its passage is easiest to time.
Sources of error. Reaction time in starting and stopping the stopwatch; parallax and the moving bob when reading the amplitude; uncertainty in the position of the centre of the bob when measuring L. For g = 4πL/T, a first-order worst-case uncertainty estimate is Δg/g ≈ ΔL/L + 2ΔT/T, using positive uncertainty magnitudes, as in the Young’s modulus experiment.
Solved examples
Example 1: Period and g
A pendulum of effective length 1.00 m makes 20 oscillations in 40.2 s, timed with a stopwatch reading to 0.1 s. Find T and g, then estimate a first-order worst-case uncertainty assuming the effective length uncertainty is ±1 mm and the total 20-cycle timing uncertainty is ±0.1 s. This timing uncertainty is an assumption, not a consequence of the display resolution alone.
T = 40.2/20 = 2.01 s. g = 4πL/T = 4π × 1.00/2.01, about 9.77 m s.
ΔT = 0.1/20 = 0.005 s, so ΔT/T ≈ 0.25%, which counts twice: 0.5%. ΔL/L = 0.1%. Total: about 0.6%, that is ±0.06 m s.
Answer: T = 2.01 s and g = 9.77 ± 0.06 m s under the stated worst-case uncertainty assumptions. Start/stop reaction scatter and calibration errors must be included when estimating an actual experiment’s timing uncertainty.
Example 2: From amplitudes to A
In an illustrative run, the amplitudes of a 1.0 m pendulum read every 20 oscillations (every 40 s) are 10.0, 8.9, 7.9, 7.1, 6.3 and 5.6 cm. Find A at each time and describe the graph of A against t.
Squaring: 100, 79.2, 62.4, 50.4, 39.7 and 31.4 cm. Each value divided by the one before gives 0.79, 0.79, 0.81, 0.79 and 0.79.
Answer: A falls steadily and by about the same fraction, roughly 0.79, in every 40 s. It halves in about 120 s.
Example 3: How much energy is lost?
For the pendulum of Example 2 with a 0.1 kg bob, find the energy at the start and after 200 s (g = 9.8 m s).
E = mgA/(2L). At the start: 0.1 × 9.8 × 0.10/(2 × 1.0) = 4.9 × 10 J. After 200 s: 0.1 × 9.8 × 0.056/2, about 1.54 × 10 J.
Answer: about 4.9 mJ falling to about 1.5 mJ: roughly 69% of the energy has been dissipated in 200 s.
Example 4: Why plot A, not A?
Why does the syllabus ask for a graph of the square of the amplitude, rather than the amplitude itself?
The energy of the pendulum is E = mgA/(2L), proportional to A, not to A. So the A–t graph shows directly how the energy changes with time; an A–t graph would show the square root of the energy.
Answer: because A is proportional to the energy, its graph against time is the energy-dissipation graph.
Example 5: Testing for an exponential fall
Using the data of Example 2, find the endpoint estimate of the slope of ln(A/A) against t, and the time for the energy to halve.
ln(31.4/100) ≈ −1.16 over 200 s, so the slope is about −0.0058 s (−0.00579 unrounded). Fit all measured points to test linearity; using this endpoint estimate, if an exponential model is appropriate, A falls exponentially, with a time constant of 1/0.00579 ≈ 173 s; the energy halves in ln 2/0.00579 ≈ 120 s, and A itself halves in about 240 s, twice as long.
Answer: slope ≈ −0.0058 s, halving time ≈ 120 s (a check beyond what the syllabus asks).
Common mistakes to avoid
Common mistake
Measuring L to the top of the bob
The effective length runs from the point of suspension to the centre of the bob: add the radius of the bob (and the hook) to the thread length.
Common mistake
Timing a single oscillation
Reaction time can be 0.1–0.2 s, a large fraction of one period. Time 20 or more oscillations and divide.
Common mistake
Using large amplitudes for the period
T = 2π√(L/g) holds only for small swings. Large swings take slightly longer.
Common mistake
Plotting A instead of A
The energy is proportional to A, so the dissipation graph must use A (Example 4).
Common mistake
Counting the first swing as one
Start the count at zero as the stopwatch starts; otherwise you time one oscillation fewer than you count.
Quick revision summary
- Period: time n oscillations, T = t/n; then g = 4πL/T with L to the centre of the bob.
- L against T is a straight line through the origin with slope g/4π.
- Energy of a pendulum: E = mgA/(2L), proportional to A.
- Reading A every few oscillations and plotting A against t shows the energy falling, because of air resistance and friction at the support.
- The illustrative turning-point data are approximately exponential. Linear underdamped motion predicts an exponential amplitude envelope; other damping laws need not.
- First-order worst-case estimate: Δg/g ≈ ΔL/L + 2ΔT/T. Independent standard uncertainties instead combine in quadrature.
Formula sheet
- T = 2π√(L/g); g = 4πL/T
- T = t/n (n oscillations in time t)
- E = mgA/(2L) (small swings)
- Δg/g ≈ ΔL/L + 2ΔT/T (first-order worst-case uncertainty)
Questions students ask
What does dissipation of energy mean in the simple pendulum experiment?
In the simple pendulum experiment, dissipation of energy means that the pendulum’s mechanical energy is gradually turned into heat, the random internal energy of the air and of the support, which does not spontaneously reassemble into the original coherent swing. The energy is not destroyed, so energy as a whole is conserved, but mechanical energy is not: each swing hands a little more of it to the surroundings. That is why a free pendulum eventually stops, and why the square of the amplitude, which is proportional to the pendulum’s energy, falls with time.
Does the time period of a pendulum change as its amplitude dies away?
For small swings and weak damping, the period is approximately constant as the amplitude decays: T = 2π√(L/g) does not depend on the amplitude, The linear damped frequency is slightly below the undamped value; whether the difference is detectable depends on the damping strength and timing precision. Early and late timing runs should agree within their uncertainties when this model applies. Larger swings take slightly longer, about 0.8% longer at 20° and 4% at 45°, so the period of a pendulum started at a large angle shortens slightly as its swings shrink.
Why does a heavy bob keep swinging longer than a light bob of the same size?
If air drag dominates and shape, size, initial speed and length are the same, a heavier bob generally loses a smaller fraction of its energy per swing because the air resistance on a bob depends on its size, shape and speed, not on its mass, while its energy, E = mgA/(2L), is proportional to its mass. So with the same drag a heavy bob loses a smaller fraction of its energy in each swing, and its amplitude falls more slowly: a denser ball can therefore keep swinging longer. Support friction may also depend on load, so this comparison is not universal. That is why the precautions ask for a heavy, compact bob: air resistance then has little effect on each swing, and the swings last long enough to follow.
What is the shape of the graph between length and time period of a simple pendulum?
The graph of length L against time period T of a simple pendulum is a parabola, because L = (g/4π)T: doubling the period needs four times the length. Drawn the other way, T against L, it is the same parabola on its side, rising steeply at first and then more slowly. Plotting L against T instead gives a straight line through the origin, which is why that graph is the one used to find g.
Practice questions
Try each question first, then open the answer to check your working.
-
Q1. Why is the stopwatch started and stopped as the bob passes the mean position, not at an extreme?
Show answerHide answer
At the mean position the bob moves fastest, so the moment it passes a mark is sharp and easy to judge. At an extreme it moves slowly and seems to hang there, so the moment of turning is hard to pick.
-
Q2. A pendulum has a thread 0.62 m long and a bob of diameter 4 cm. Find its effective length and expected period (g = 9.8 m s).
Show answerHide answer
L = 0.62 + 0.02 = 0.64 m. T = 2π√(0.64/9.8), about 1.61 s.
-
Q3. What two causes make the amplitude of a real pendulum decrease?
Show answerHide answer
Air resistance on the bob and thread, and friction at the point of suspension. Both turn some of the pendulum’s mechanical energy into heat on every swing.