Photoelectric effect and the wave theory of light
NCERT Class 12 Physics Chapter 11 Section 11.5
Quick answer
The fully classical energy-accumulation picture fails to reproduce the threshold frequency, prompt emission and intensity-independent maximum photoelectron energy. Einstein’s photon model, E = hν (one quantum), explains these laws; quantum matter interacting with a classical field can also reproduce the basic photoelectric laws, so these observations alone do not prove every feature of field quantisation.
With your textbook
NCERT Physics Part II (Class 12), Chapter 11 “Dual Nature of Radiation and Matter”, Section 11.5 “Photoelectric Effect and Wave Theory of Light”, pages 280–281.
Open the official NCERT chapter (PDF, 1.8 MB, ncert.nic.in) (opens in a new tab)
Checked against the 2026-27 reprint on .
Why can’t the wave theory explain the photoelectric effect?
Photoelectric effect and the wave theory of light
By the end of the 19th century the wave theory explained interference, diffraction and polarisation. But treated as a wave spreading its energy continuously, light should give photoelectrons more energy when it is more intense, should eject them at any frequency if it is intense enough or shines long enough, and should take a long time to do it. Experiment shows none of this (NCERT Section 11.5, pages 280–281). NCERT concludes:
In short, the wave picture is unable to explain the most basic features of photoelectric emission.
NCERT Physics Part II (Class 12), Section 11.5, page 281
In plain words: think of light as a wave washing over the metal, sharing its energy among all the electrons. Then a brighter wave should hit each electron harder, and any wave, given time, should eventually fill an electron up enough to escape. But brightness doesn’t change the electrons’ top speed, ordinary red illumination below threshold does not produce one-photon emission from copper, and when emission happens it happens at once.
Regime: the standard one-photon photoelectric model at ordinary intensity, with a fixed clean surface and negligible heating, space charge, contact-potential offsets and background current. Multiphoton/strong-field emission can occur outside this regime. “Instantaneous” means no classical energy-accumulation delay, not literally zero interaction time or zero random waiting time for the next photon. Photon absorption does not guarantee electron escape. Here “wave picture” means the historical fully classical model of continuous energy absorption by classical electrons. Quantised matter interacting with a classical driving field can reproduce basic photoelectric laws; the photoelectric effect alone is not a proof of every specifically quantum property of the radiation field. Einstein’s photon description remains the useful syllabus model (beyond NCERT: R. G. Littlejohn, The Photoelectric Effect, UC Berkeley graduate quantum-mechanics notes).
The wave picture of light
- In the wave picture, light is an electromagnetic wave of electric and magnetic fields, with its energy spread continuously over the region the wave fills (NCERT page 280).
- The free electrons at the metal surface would then absorb energy continuously. More intense light means larger field amplitudes, so each electron should absorb more energy (NCERT page 281).
- The energy is shared over the whole wavefront, among a very large number of electrons, so each electron gains energy only slowly (NCERT page 281).
Why the wave picture fails
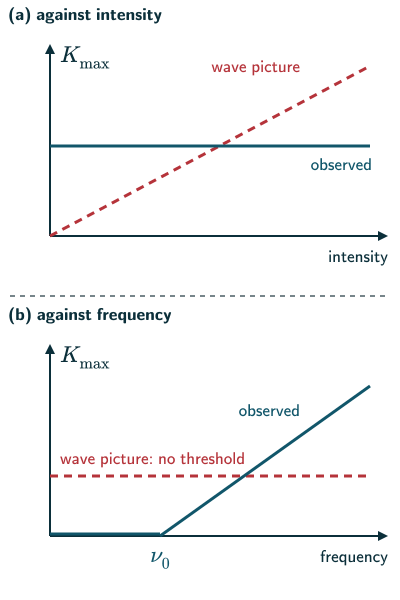
- Maximum kinetic energy and intensity. The wave picture expects Kmax to increase with intensity. Experiment finds the stopping potential, and so Kmax, independent of intensity (NCERT pages 279 and 281).
- Threshold frequency. The wave picture expects light of any frequency, if intense enough and given enough time, to give an electron enough energy to escape, so there should be no threshold. Experiment finds no emission at all below the threshold frequency, however intense the light (NCERT pages 280–281).
- Time lag. In the wave picture each electron gets a small share of the energy, and calculations estimate that it could take hours or more to collect enough to escape. Experiment finds emission within about 10−9 s, even for very dim light (NCERT pages 280–281; see Example 1).
- NCERT says these expectations “directly contradict observations (i), (ii) and (iii)” of its list at the end of Section 11.4, and that the time estimate contradicts (iv) (NCERT page 281). That overstates it: a wave picture has no trouble with (i), a photocurrent that grows with intensity, nor with the saturation current in (ii) doing the same. The real conflicts are the stopping potential’s independence of intensity in (ii) and the threshold in (iii) (reasoned).
- The stopping potential is the key test: its independence of intensity and its dependence on frequency separate the wave picture from the photon picture (NCERT Points to ponder 5, page 288).
- The way out, given by Einstein in 1905, is to treat light energy as coming in discrete quanta of energy hν, each absorbed whole by a single electron (NCERT Section 11.6, page 281).
Solved examples
Example 1: How long would a wave take?
Dim light of intensity 1.0 × 10⁻³ W/m2 falls on a metal of work function 2.0 eV. Suppose each electron could collect all the energy falling on an area the size of an atom, about 1 × 10⁻²⁰ m2. How long would it take to collect 2.0 eV?
Answer: Power per electron = 1.0 × 10−3 × 1 × 10−20 = 1 × 10⁻²³ W. Energy needed = 2.0 × 1.6 × 10−19 = 3.2 × 10⁻¹⁹ J. Time = 3.2 × 10⁻¹⁹/(1 × 10−23) ≈ 3 × 10⁴ s, about 9 hours, against an observed delay of about 10−9 s (reasoned; NCERT says such estimates give hours or more, page 281). These assumptions favour the wave picture: a real metal reflects much of the light, so the wait would be longer still.
Example 2: Bright red against dim ultraviolet
A copper plate is lit (a) by ordinary red light for an hour, (b) by faint ultraviolet light above copper’s threshold for a moment. What does the wave picture expect, and what happens?
Answer: The wave picture expects (a) to eject electrons, since a lot of energy arrives, and (b) to need a long wait. In fact (a) ejects none, because red light is below copper’s threshold, and (b) ejects electrons at once (NCERT pages 280–281).
Example 3: Doubling the intensity
Light of a fixed frequency above the threshold is made twice as intense. What does the wave picture predict for Kmax, and what is observed?
Answer: The wave picture predicts a larger Kmax, from the larger field amplitude. Observed: Kmax and the stopping potential are unchanged; only the photocurrent doubles (NCERT pages 279 and 281).
Example 4: Which observation decides?
Which single measurement best separates the wave and photon pictures?
Answer: The stopping potential: it does not depend on the intensity but does depend on the frequency, which the wave picture cannot explain (NCERT Points to ponder 5, page 288).
Common mistakes to avoid
Common mistake
Saying the wave theory of light is simply wrong
It explains interference, diffraction and polarisation; it fails for the way light gives up its energy to electrons (NCERT pages 280–281).
Common mistake
Thinking long exposure makes up for low frequency
Below the threshold frequency no electrons come out, however long or intense the light (NCERT pages 280 and 282).
Common mistake
Reading the photon picture as “light is only particles”
NCERT notes that the photoelectric effect shows energy is absorbed in units of hν, which is not quite the same as saying light consists of particles (NCERT Points to ponder 4, page 288).
Quick revision summary
- Wave picture: energy spread continuously over the wavefront and absorbed continuously by the electrons.
- It predicts Kmax rising with intensity, no threshold frequency, and a long delay.
- Experiment: Kmax independent of intensity, a threshold frequency, emission within about 10−9 s.
- The stopping potential’s independence of intensity and dependence on frequency is the decisive test.
- Einstein’s quanta of energy hν, each absorbed by one electron, explain the effect.
Formula sheet
- time ≈ energy needed / power per electron
- E = hν (one quantum)
Questions students ask
Why can the wave theory not explain the rise of the stopping potential with frequency?
The wave theory cannot explain why the stopping potential rises with frequency, because in the wave picture the energy an electron absorbs depends on the intensity and on how long the light shines, so it does not yield the observed universal linear relation Kmax = hν − φ. Classical absorption can itself be frequency-dependent; the problem is explaining the measured quantum relation (reasoned from NCERT page 281). Experiment finds that above the threshold the stopping potential, and so Kmax, rises in a straight line with frequency at any intensity (NCERT page 280). That line has the same slope, h/e, for every metal, which Einstein’s quanta of energy hν explain and the classical continuous-energy electron-absorption model does not (NCERT pages 282–283).
Can very intense light below the threshold frequency eject electrons?
In the ordinary one-photon regime, light below the threshold does not eject electrons, which the wave theory could not explain (NCERT pages 280–281). With the very intense light of a laser, an electron can occasionally absorb two photons at once: in 1964 Teich, Schroeer and Wolga drew a current from a sodium surface of work function 1.95 eV with laser photons of only 1.48 eV each, enough in pairs (beyond the NCERT text; Physical Review Letters, vol. 13). This does not rescue the wave theory, since the energy still arrives in whole quanta and the current rose as the square of the laser power, the mark of two photons acting together; use the one-photon threshold for ordinary syllabus problems unless nonlinear emission or heating is explicitly specified.
What is the difference between the photoelectric effect and the double-slit experiment?
The double-slit experiment shows light acting as a wave, giving interference fringes, while the photoelectric effect shows it giving up energy to matter in whole quanta of hν (NCERT pages 281 and 284–285; Young’s experiment). They do not clash: which description suits depends on the experiment (NCERT page 285; dual nature). Beyond the NCERT text, both show at once: with extremely attenuated classical light, fringes round a needle’s shadow still formed in a three-month exposure; this historical experiment preserved interference at low mean light level, rather than preparing modern single-photon number states (G. I. Taylor, 1909).
Practice questions
Try each question first, then open the answer to check your working.
-
Q1. State three features of photoelectric emission that the wave picture cannot explain.
Show answerHide answer
Kmax does not depend on intensity; there is a threshold frequency; emission is instantaneous (NCERT pages 280–281).
-
Q2. According to the wave picture, why should more intense light give faster photoelectrons?
Show answerHide answer
More intense light has larger electric and magnetic field amplitudes, so each electron should absorb more energy (NCERT page 281).
-
Q3. Why does the wave picture predict a time lag?
Show answerHide answer
The energy is spread over the whole wavefront and shared among many electrons, so each gains energy slowly; estimates give hours or more (NCERT page 281).