Experimental study of the photoelectric effect
NCERT Class 12 Physics Chapter 11 Section 11.4
Quick answer
In ordinary one-photon photoemission, raising intensity at fixed frequency and collection conditions raises saturation current, while the maximum electron energy and stopping potential depend on frequency. With stopping-potential magnitude V0, Kmax = eV0; emission is prompt after absorption, without the classical energy-accumulation delay.
With your textbook
NCERT Physics Part II (Class 12), Chapter 11 “Dual Nature of Radiation and Matter”, Section 11.4 “Experimental Study of Photoelectric Effect”, pages 277–280.
Open the official NCERT chapter (PDF, 1.8 MB, ncert.nic.in) (opens in a new tab)
Checked against the 2026-27 reprint on .
What does the photoelectric experiment show?
Experimental study of the photoelectric effect
In an evacuated tube, light falls on a photosensitive plate C (the emitter) and the electrons it releases are collected by a plate A (the collector). Varying the light’s intensity and frequency and the potential of A shows four facts: the photocurrent is proportional to the intensity; the stopping potential that stops all the electrons does not depend on the intensity; there is a threshold frequency below which no electrons come out; and emission starts at once (NCERT Section 11.4, pages 277–280). In NCERT’s words:
Thus, for a given frequency of the incident radiation, the stopping potential is independent of its intensity.
NCERT Physics Part II (Class 12), Section 11.4, page 279
In plain words: brighter light knocks out more electrons, but not faster ones. To stop even the fastest electrons you need a certain reverse voltage, and that voltage depends on the colour (frequency) of the light, not on its brightness. Below a certain frequency nothing comes out at all.
Regime: the standard one-photon photoelectric model at ordinary intensity, with a fixed clean surface and negligible heating, space charge, contact-potential offsets and background current. Multiphoton/strong-field emission can occur outside this regime. “Instantaneous” means no classical energy-accumulation delay, not literally zero interaction time or zero random waiting time for the next photon. Photon absorption does not guarantee electron escape. At fixed frequency, unchanged illuminated area and collection efficiency are needed for current to scale with intensity. V is a positive stopping-voltage magnitude; the ideal collector potential at cutoff is −V relative to the emitter.
The experimental set-up
- An evacuated glass or quartz tube, as in Lenard’s experiment, holds a thin photosensitive plate C and a metal plate A. Monochromatic light from a source S passes through a quartz window W, which lets ultraviolet light through, and falls on C (NCERT page 277, Figure 11.1).
- A battery keeps a potential difference between C and A that can be varied, and a commutator reverses it, so A can be made positive or negative with respect to C. A voltmeter measures the potential difference and a microammeter the photocurrent (NCERT page 277).
- The arrangement can study how the photocurrent depends on (a) the intensity of the light, (b) its frequency, (c) the potential difference between A and C, and (d) the material of C. Filters select a wavelength band from a broadband source rather than changing each photon’s frequency; moving the source changes the intensity (NCERT pages 277–278).
- When A is positive, the electrons from C are attracted to it and a current flows in the circuit (NCERT page 277). The current in the circuit is an ordinary electric current, carried across the tube by the photoelectrons.
Effect of intensity of light on photocurrent
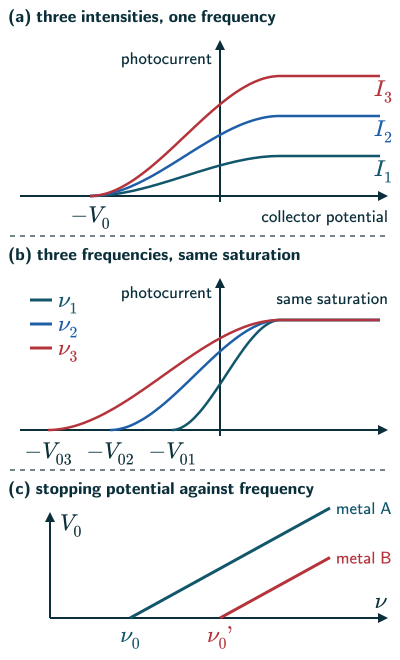
- With A positive and the frequency and potential fixed, the photocurrent increases linearly with the intensity of the light (NCERT page 278, Figure 11.2).
- The photocurrent equals e times the number collected per second; if the collection fraction is fixed, it is proportional to the number emitted per second, so that number is proportional to the intensity (NCERT page 278).
Effect of potential on photoelectric current
- With the frequency and intensity fixed, making A more positive (an accelerating potential) increases the photocurrent at first (NCERT page 278).
- Making A negative (a retarding potential) repels the electrons, and only the more energetic ones reach A. The current falls rapidly and becomes zero at a sharply defined negative potential −V0 (NCERT page 278, Figure 11.3).
Saturation current
- Beyond a certain positive potential of A, all the electrons emitted by C are collected and the current stops rising. This maximum current is the saturation current (NCERT page 278).
- For one frequency, the saturation current is proportional to the intensity: more intense light releases more electrons per second (NCERT page 279, Figure 11.3).
- For the comparison of frequencies, NCERT says it sets “the same intensity of light radiation at various frequencies” and gets the same saturation current (NCERT page 279, Figure 11.4). Take this with care: a photon of higher frequency carries more energy, so light of equal intensity brings fewer photons each second and would not, in general, give the same current. Read Figure 11.4 as light adjusted to release the same number of electrons per second (reasoned from NCERT pages 282–283).
Stopping potential
- The stopping (or cut-off) potential V0 is the least retarding potential of A at which the photocurrent becomes zero (NCERT page 278).
- The emitted electrons do not all have the same energy. The current stops when the retarding potential turns back even the most energetic ones, those with the maximum kinetic energy Kmax (NCERT Eq. (11.1), page 279):
Stopping potential (NCERT Eq. 11.1)
- For a given frequency the stopping potential is the same for every intensity (NCERT page 279, Figure 11.3). So Kmax depends on the light source and the emitter material, but not on the intensity (NCERT page 279).
Effect of frequency of incident radiation on stopping potential
- With the light at each frequency adjusted to give the same saturation current, the stopping potential changes: it is larger in size for higher frequencies, V03 > V02 > V01 for ν3 > ν2 > ν1. So the higher the frequency, the greater the maximum kinetic energy of the photoelectrons (NCERT page 279, Figure 11.4).
- A graph of stopping potential against frequency is a straight line for each photosensitive material (NCERT page 279, Figure 11.5).
- The lines for different metals are parallel. NCERT explains why in Section 11.6: NCERT Eq. (11.4) gives every line the same slope h/e, whatever the metal (NCERT pages 282–283).
- NCERT slip (page 279): the caption of NCERT Figure 11.5 speaks of “a given photosensitive material”, but the graph shows two metals, one line for each.
Threshold frequency
- Each line meets the frequency axis at a minimum cut-off frequency ν0, where the stopping potential is zero. Below ν0 no photoelectric emission is possible, however intense the light. This threshold frequency is different for different metals (NCERT pages 279–280).
- Different materials respond differently: selenium is more sensitive than zinc or copper, and ultraviolet light ejects electrons from copper while green or red light does not (NCERT page 280).
- Above the threshold, emission starts instantaneously, with no apparent time lag even for very dim light: within about 10−9 s or less (NCERT page 280).
- The four observations (NCERT page 280): (i) photocurrent ∝ intensity; (ii) saturation current ∝ intensity, stopping potential independent of intensity; (iii) a threshold frequency below which there is no emission, and above it the stopping potential, and so Kmax, rises linearly with frequency; (iv) emission is instantaneous.
Solved examples
Example 1: From cut-off voltage to energy (NCERT Exercise 11.3)
The photoelectric cut-off voltage in an experiment is 1.5 V. What is the maximum kinetic energy of the photoelectrons?
Answer: Kmax = eV0 = 1.5 eV = 1.5 × 1.6 × 10−19 J = 2.4 × 10⁻¹⁹ J (NCERT Eq. (11.1), page 279; Exercise 11.3, page 289; answer on page 351).
Example 2: The fastest photoelectrons
The stopping potential is 0.60 V. Find the maximum speed of the photoelectrons.
Answer: ½mvmax2 = eV0 = 0.60 × 1.6 × 10−19 = 9.6 × 10⁻²⁰ J. With m = 9.11 × 10⁻³¹ kg, vmax2 ≈ 2.1 × 10¹¹ m2/s2, so vmax ≈ 4.6 × 10⁵ m/s (NCERT Eq. (11.1), page 279).
Example 3: Doubling the intensity
The light falling on the emitter is made twice as intense at the same frequency. What happens to the saturation current and to the stopping potential?
Answer: The saturation current doubles, since twice as many electrons are emitted each second; the stopping potential is unchanged, since it depends on the frequency, not the intensity (NCERT pages 278–279).
Example 4: Below the threshold
Red light is shone on a copper plate for a long time, very brightly. Does a photocurrent flow?
Answer: No. Red light is below copper’s threshold frequency; there is no ordinary one-photon emission below threshold, however long the exposure; intense heating and nonlinear laser effects are outside this model (NCERT pages 280 and 282).
Common mistakes to avoid
Common mistake
Thinking brighter light raises the stopping potential
Intensity changes the saturation current only; the stopping potential depends on the frequency and the metal (NCERT page 279).
Common mistake
Confusing volts with joules
Kmax = eV0: in joules multiply V0 by e; in electron volts the number equals V0 in volts (NCERT Eq. (11.1), page 279).
Common mistake
Expecting a delay for dim light
There is no detectable classical energy-accumulation delay; NCERT quotes an emission response within about 10 s, while very dim light can still give long random waits between detected electrons, as long as the frequency is above the threshold (NCERT page 280).
Quick revision summary
- Set-up: emitter C, collector A, quartz window, variable and reversible potential, microammeter.
- Photocurrent and saturation current are proportional to the intensity.
- Stopping potential V0: the retarding potential at which the current stops; Kmax = eV0, independent of intensity.
- Higher frequency gives a larger stopping potential; V0 against ν is a straight line for each metal.
- Below the threshold frequency ν0 there is no emission at all; above it emission is instantaneous (about 10−9 s).
Formula sheet
- Kmax = eV0
- photocurrent ∝ intensity
Questions students ask
Why is the stopping potential negative, and how is it different from a retarding potential?
The stopping potential is negative because it is the collector’s potential relative to the emitter, and the collector must be negative to push the photoelectrons back; V0 is quoted as its size, so that Kmax = eV0 is positive (NCERT pages 278–279). Any negative collector potential is a retarding potential: a small one turns back only the slower electrons, so the current falls but does not stop. The stopping potential is the least retarding potential that turns back even the fastest, making the current zero; on the current–potential graph it is where each curve meets the axis, at −V0.
Why does the stopping potential not depend on the intensity of light?
The stopping potential does not depend on the intensity because it measures only the largest kinetic energy one electron carries away, and each electron gets its energy from a single quantum of light, hν, set by the frequency alone (NCERT pages 279 and 281–282). Brighter light of the same frequency brings more quanta each second, so more electrons and a larger current, but no electron gets more energy: in Einstein’s equation, eV0 = hν − φ0, only the frequency and the metal appear. The wave picture expected the opposite.
Why does a photocurrent flow even when the collector is at zero potential?
A photocurrent flows at zero collector potential because the photoelectrons leave the emitter with kinetic energies of their own, from almost zero up to Kmax, so many reach the collector unaided: the light, not the battery, drives the current (reasoned from NCERT Figure 11.3, page 278). A positive potential also gathers those that would miss the collector or fall back, until all arrive at saturation; a negative one turns back first the slowest and then faster ones, so the current falls rapidly but not in one step, reaching zero at −V0. The energies are spread because the metal’s free electrons start with different energies (NCERT Points to ponder 2–3, page 288).
Does the saturation current depend on the frequency of the light?
For fixed frequency and quantum yield, saturation current is proportional to intensity. Frequency independence is not a general law: NCERT says the photocurrent depends on the intensity, the potential difference and the emitter material (Summary point 3, page 287), and its Figure 11.4 shows one saturation current at three frequencies (page 279). At equal intensity, though, higher-frequency light brings fewer photons, each carrying more energy hν. For a metal from which both can eject electrons, 340 nm light brings only 2/3 as many photons as 510 nm light, so if each photon were as likely to free an electron, its saturation current would be 2/3 as large (reasoned from NCERT pages 282–283).
What does the graph of stopping potential against wavelength look like?
Against wavelength, the stopping potential falls along a curve, not a straight line, because V0 = hc/(eλ) − φ0/e: it is large at short wavelengths and falls to zero at the threshold wavelength, beyond which there is no emission (reasoned from NCERT Eq. (11.4), page 282, and c = νλ). Plotted against 1/λ instead, it is a straight line whose slope, hc/e ≈ 1.24 × 10 V m, is the same for every metal, like the graph against frequency.
What are the SI unit and dimensional formula of stopping potential?
The stopping potential is a potential difference, so its SI unit is the volt and its dimensional formula is [M L T A] (NCERT page 288), as for any electric potential. That follows from potential being energy per unit charge: [M L T] divided by the dimensions of charge, [A T].
Practice questions
Try each question first, then open the answer to check your working.
-
Q1. What is the saturation current in a photoelectric experiment?
Show answerHide answer
The largest photocurrent, reached when the collector is positive enough to collect every electron the emitter releases (NCERT page 278).
-
Q2. The stopping potential is 2.0 V. Find the maximum kinetic energy of the photoelectrons in eV and in joules.
Show answerHide answer
Kmax = eV0 = 2.0 eV = 3.2 × 10⁻¹⁹ J (NCERT Eq. (11.1), page 279).
-
Q3. Which of these changes the stopping potential: (a) the intensity of the light, (b) its frequency, (c) the metal of the emitter?
Show answerHide answer
(b) and (c). The stopping potential is independent of the intensity (NCERT pages 279 and 287, Summary point 4).