Venn diagrams
NCERT Class 11 Mathematics Chapter 1 Section 1.8
Quick answer
A Venn diagram shows sets as pictures: the universal set U is a rectangle and its subsets are circles inside it, with each element written once in its region. A circle inside another shows a subset, separate circles show disjoint sets, and overlapping circles show sets with some common elements. They are named after the English logician John Venn (1834–1923).
With your textbook
NCERT Mathematics (Class 11), Chapter 1 “Sets”, Section 1.8 “Venn Diagrams”, page 13.
Open the official NCERT chapter (PDF, 2.2 MB, ncert.nic.in) (opens in a new tab)
Checked against the 2026-27 reprint on .
What is a Venn diagram?
Venn diagram
Most of the relationships between sets can be represented by means of diagrams which are known as Venn diagrams.
NCERT Mathematics (Class 11), Section 1.8, page 13
- The universal set U is drawn as a rectangle, and its subsets as closed curves, usually circles, inside it.
- The elements of each set can be written inside its circle.
- The diagrams are named after the English logician John Venn (1834–1923); NCERT (page 13) prints his dates as 1834–1883, but he died in 1923.
In plain words: a Venn diagram is a picture of sets. The rectangle is everything under discussion; each circle fences off one set. Where circles sit inside each other, overlap or stay apart shows at a glance whether one set is a subset of another, whether two sets share elements, or whether they have nothing in common.
NCERT’s two illustrations
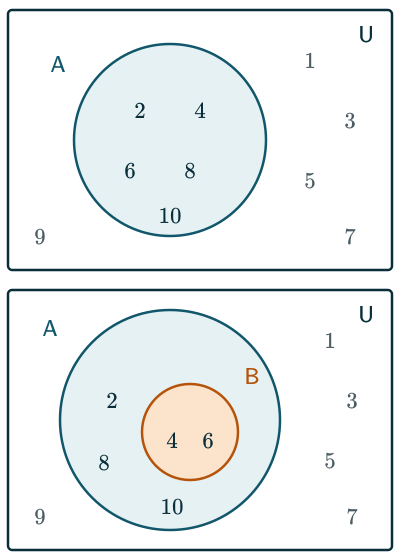
Illustration 1. U = {1, 2, 3, …, 10} and A = {2, 4, 6, 8, 10}. The circle A holds the even numbers; 1, 3, 5, 7 and 9 lie in the rectangle outside A (NCERT Fig. 1.2, page 13).
Illustration 2. With the same U and A, let B = {4, 6}. Every element of B is in A, so B ⊂ A, and the circle B is drawn inside the circle A (NCERT Fig. 1.3, page 13).
How two sets can sit
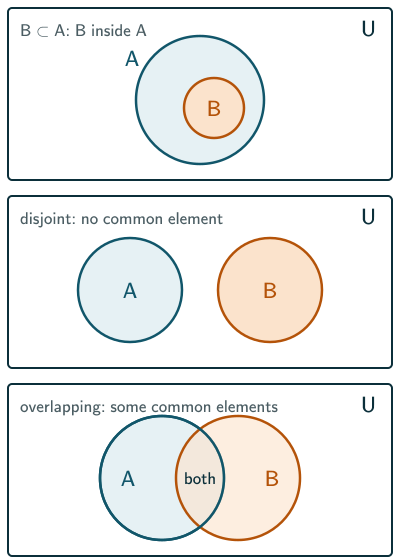
For non-empty sets A and B inside U, the following simplified pictures show how they are related:
- one inside the other, when one set is a proper subset of the other: B inside A if B ⊂ A and B ≠ A (as in Illustration 2), or A inside B in the reverse case;
- one boundary with both labels, when A = B;
- apart, not touching, when A and B have no common element (disjoint sets, such as the even and the odd numbers);
- overlapping, when A and B share some elements but neither contains the other; the shared part holds the common elements.
When the relation is not known, the overlapping picture is the safe general drawing: a region of it may simply turn out to be empty. For three sets A, B and C, the general drawing is three mutually overlapping circles: 7 regions inside the circles and 1 outside, 8 in all (23). The centre holds the elements common to all three. In counting problems each region holds the number of its elements rather than the elements themselves.
The same pictures are used for union, intersection, difference and complement (NCERT Sections 1.9 and 1.10).
Venn diagrams are also a convenient way to sort things in other subjects. For example, if each element is counted in one block only (helium, 1s2, is strictly s-block although it sits in group 18), the s-block, p-block, d-block and f-block elements are four disjoint subsets of the set of all elements, so their circles are drawn apart.
Solved examples
Example 1: Placing elements
Let U = {1, 2, 3, …, 10}, A = {1, 2, 3, 4, 5} and B = {4, 5, 6, 7}. Say where each element of U goes in an overlapping Venn diagram of A and B.
4 and 5 are in both sets, so they go in the shared part. 1, 2 and 3 are in A only; 6 and 7 are in B only; 8, 9 and 10 are in neither and go outside both circles.
Answer: shared part {4, 5}; A only {1, 2, 3}; B only {6, 7}; outside both {8, 9, 10}.
Example 2: Choosing the picture
How should the circles be drawn for (i) A = {2, 4, 6}, B = {1, 3, 5}; (ii) A = {1, 2, 3}, B = {1, 2, 3, 4}; (iii) A = {1, 2}, B = {2, 3}?
(i) No common element. (ii) Every element of A is in B. (iii) 2 is shared, but each set has an element the other lacks.
Answer: (i) apart (disjoint); (ii) circle A inside circle B; (iii) overlapping, with 2 in the shared part.
Example 3: Reading a diagram
In a diagram, the shared part of A and B holds c, the part of A outside B holds a and b, the part of B outside A holds d, and e lies outside both circles. Write U, A and B.
Collect each set from all the regions inside its circle.
Answer: U = {a, b, c, d, e}, A = {a, b, c}, B = {c, d}.
Common mistakes to avoid
Common mistake
Writing an element twice
Each element goes in exactly one region. A common element of A and B is written once, in the shared part, not once in each circle.
Common mistake
Forgetting the elements outside every circle
Elements of U that belong to none of the sets still belong in the rectangle, outside the circles.
Common mistake
Drawing circles inside each other without checking
B is drawn wholly inside A when B is a proper subset of A; if A is a proper subset of B, reverse the nesting. Equal sets can share one boundary with both labels. Draw partial overlap only when the sets share an element and neither contains the other; draw non-empty disjoint sets apart. Here ⊂ follows NCERT and allows equality, so the proper-subset case also requires the sets to differ.
Quick revision summary
- Venn diagram: U as a rectangle, subsets as circles inside it; elements written in their regions.
- B ⊂ A: circle inside circle; disjoint sets: separate circles; otherwise overlapping circles.
- Each element of U appears exactly once.
Formula sheet
- U: rectangle; A, B, …: circles inside U
- B ⊂ A: circle B inside circle A
- A, B disjoint: circles drawn apart
Questions students ask
What is the difference between a Venn diagram and an Euler diagram?
A Venn diagram draws every possible region for its sets, using overlapping circles for two or three sets even when some regions turn out to be empty, while an Euler diagram draws only the relations that actually hold, with a subset inside its superset and disjoint sets apart. By that strict definition, NCERT’s picture of B ⊂ A as one circle inside another is an Euler diagram, although NCERT and most textbooks call every such picture a Venn diagram. Euler diagrams are the older of the two: Leonhard Euler used circles for logic in his “Letters to a German Princess”, published from 1768.
Who invented the Venn diagram?
The Venn diagram was introduced by the English logician John Venn (1834–1923), a lecturer at Cambridge, in an 1880 paper on representing logical statements by diagrams, and it is named after him. Venn drew the circles overlapping so that every combination of being inside or outside each set had its own region, and in his logic diagrams shading a region meant that it was empty. School set diagrams use shading the other way, to mark the region a question asks for.
How do you shade a set expression such as (A ∩ B) ∪ C in a Venn diagram?
To shade a set expression in a Venn diagram, go region by region and shade a region only when its elements satisfy the expression, reading ∪ as “or” and ∩ as “and”. For (A ∩ B) ∪ C in a three-set diagram, an element qualifies if it is in C or in both A and B, so shade all four regions inside circle C and the one part of A ∩ B that lies outside C: five of the eight regions. Union, intersection and difference are defined in NCERT Section 1.9, Operations on Sets (pages 14–16).
How are equal sets and the empty set shown in a Venn diagram?
In a simplified Euler-style picture, equal non-empty sets share one circle labelled with both names, such as A = B, and non-empty disjoint sets are drawn apart. An empty set can be omitted or explicitly labelled empty. In a general overlapping Venn diagram, keep all regions and mark the empty ones as empty or 0 in a counting problem: equality makes both exclusive regions empty, while disjointness makes the intersection empty. A blank region alone need not mean empty unless all elements have been listed.
What are Venn diagrams used for?
Venn diagrams are used to see at a glance how sets are related, to check set identities such as De Morgan’s laws before proving them, and to solve counting problems by writing the number of elements in each region. Outside the sets chapter they appear in probability, where the rectangle is the sample space, and in the logical reasoning (syllogism) questions of many competitive exams. They suit two or three sets best: four circles cannot show all 16 regions that four sets need, so diagrams for four or more sets use ovals or other shapes.
Practice questions
Try each question first, then open the answer to check your working.
-
Q1. U = {1, 2, …, 10}, A = {2, 3, 5, 7}. Which elements of U lie outside circle A?
Show answerHide answer
1, 4, 6, 8, 9 and 10.
-
Q2. How should A = {a, e, i, o, u} and B = {a, b, c, d} be drawn?
Show answerHide answer
As overlapping circles: a is in both, but each set has elements the other lacks. Only a goes in the shared part.
-
Q3. U is the set of letters of the English alphabet, V the vowels. Is it right to draw V inside U?
Show answerHide answer
Yes: every vowel is a letter, so V ⊂ U, and every set under discussion is drawn inside the rectangle U.