Errors in measurement
Beyond NCERT In the JEE Main and NEET syllabus; the Class 11 book has no section for it.
Quick answer
Measurement error is the difference from a reference value; uncertainty describes doubt about a result. Systematic effects cause a constant or predictable bias, while random effects cause scatter; precision means repeatability, and resolution means the smallest distinguishable change. For separate input bounds, absolute bounds add in sums and differences; for small relative uncertainties, product and quotient bounds are approximated by adding relative bounds.
What are errors in measurement?
Errors in measurement
The error in a measurement is the difference between the measured value and the true value. Every measurement has some error. Errors are described by:
- accuracy (closeness to a reference or true value) and precision (agreement between repeated readings); instrument resolution describes how fine a change can be distinguished;
- their kind: systematic effects cause a constant or predictable bias; random effects cause unpredictable scatter;
- their size: absolute, relative and percentage error.
For separately measured inputs, worst-case absolute uncertainty bounds add in sums and differences. For products and quotients, adding relative bounds is a first-order approximation when the relative uncertainties are small.
Every measurement involves errors.
NCERT Physics Part I (Class 11), Section 1.3, page 3
The JEE Main 2027 syllabus (Unit 1, Units and Measurements) and the NEET (UG) 2026 syllabus (Unit 1, Physics and Measurement) both list “Errors in measurements”. The 2026–27 NCERT book has no separate section on it: Section 1.3.3 (pages 6–7) touches relative error and how errors combine in a product. This page covers the standard treatment.
In plain words: no ruler, clock or balance is perfect, and no one reads them perfectly. The aim is not to avoid error, which is impossible, but to know how big it is and to report it honestly alongside the result.
Accuracy and precision
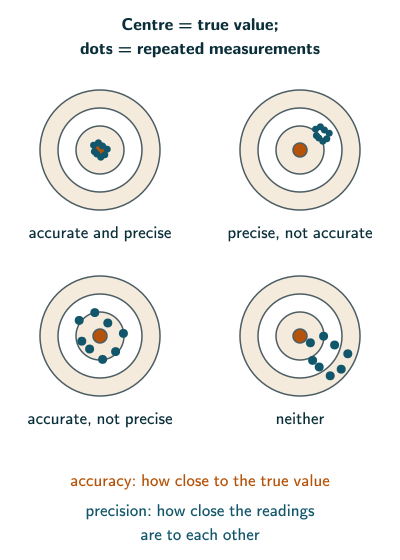
- Accuracy is how close the measured value is to the true value.
- Precision describes how closely repeated readings agree under the same conditions. Resolution is the smallest change the instrument can distinguish; a finer scale alone does not establish repeatability. This distinction follows the BIPM International Vocabulary of Metrology (beyond the NCERT text).
A measurement can be precise but inaccurate. If a rod has reference length 5.678 cm, repeated readings 5.732, 5.733 and 5.732 cm form a tight cluster but are all too large. They show good repeatability with a bias of about 0.054 cm. A single fine-looking reading would not establish precision.
Systematic and random errors
Systematic errors are constant or vary predictably under specified conditions. A zero error is an offset; a calibration error can instead grow with the reading. Simply averaging repeated readings does not remove the bias. They come from:
- the instrument: a scale that is wrongly calibrated, or a zero error (vernier callipers that read 0.02 cm with the jaws closed);
- the method: for example, treating a pendulum’s string length as its effective length while omitting the distance to the bob’s centre;
- the observer: for example, always reading a scale from slightly to one side (parallax).
They are reduced by better instruments and techniques, and by correcting for known effects such as zero error.
Random errors vary irregularly from one reading to the next, in both directions, because of small unpredictable changes in conditions and in the observer’s judgement. Their effect on the estimated mean usually decreases when independent readings are repeated under stable conditions. Averaging does not eliminate uncertainty or correct a bias.
The least count describes the scale increment: a metre scale with millimetre marks has least count 1 mm. In the school convention used here, take the uncertainty of a directly read value as one least count unless the question specifies otherwise; NCERT uses 16.2 ± 0.1 cm (Section 1.3.3, page 6). This is a reporting convention, not a universal uncertainty law. Analogue interpolation, two-endpoint length measurements and manufacturer specifications can require a different estimate. Identical displayed readings do not prove zero uncertainty. Vernier callipers or a screw gauge provide a finer scale, but calibration and technique still matter.
Absolute, relative and percentage error
Suppose a quantity is measured n times, giving a1, a2, …, an.
- For equally reliable readings under stable conditions, estimate the value using the mean: amean = (a1 + a2 + … + an)/n.
- The signed deviation of reading k from the mean is Δak = ak − amean. Its absolute deviation is |Δak|. Neither is the actual error relative to the unknown true value.
- The mean absolute error is the average of their sizes: Δamean = (|Δa1| + |Δa2| + … + |Δan|)/n. In this school mean-absolute-error convention, report a = amean ± Δamean. It describes scatter, not a guaranteed interval containing the true value, and it does not include an uncorrected bias.
- The relative error is Δamean/amean, and the percentage error is that times 100%.
The relative error tells you how good a measurement is. NCERT’s example: ±0.01 g is ±1% of 1.02 g but only ±0.1% of 9.89 g (Section 1.3.3, page 6). In NCERT’s words, with n the number of significant figures (not the number of readings used above):
The relative error of a value of number specified to significant figures depends not only on n but also on the number itself.
NCERT Physics Part I (Class 11), Section 1.3.3, page 6
Combination of errors
Here ΔA, ΔB and ΔC are positive uncertainty bounds, not signed errors. The sum rule gives a conservative bound. The product, quotient and power rules below are first-order worst-case approximations for small relative uncertainties and positive, non-zero input values; products of small errors are neglected. The symbols p, q and r denote non-negative powers in the stated product/quotient form. For a negative exponent, use its magnitude when adding relative contributions.
Do not treat repeated occurrences of the same measurement as independent: if Z = A − A, then Z is exactly zero, not a difference of two separate uncertain readings. Statistical standard uncertainties use a different model, discussed in Questions students ask.
Sum or difference, Z = A + B or Z = A − B: the absolute errors add,
even for a difference. Subtracting two nearly equal quantities can therefore give a large relative error (Example 2).
Product or quotient, Z = AB or Z = A/B: the relative errors add,
This is the rule NCERT uses for the area of a sheet, 164 ± 3 cm (Section 1.3.3, page 6).
Powers, Z = ApBq/Cr: each relative error is multiplied by its power,
Compare each contribution: the magnitude of the exponent multiplied by that input’s relative uncertainty. A larger exponent alone does not guarantee the largest contribution. This is why T in the pendulum experiment is timed over many oscillations: in g = 4πL/T its error counts twice. The same rule is used in the Young’s modulus experiment.
Solved examples
Example 1: Mean and errors from repeated readings
The period of a pendulum is found five times, each time by timing 20 oscillations: 1.52, 1.49, 1.55, 1.50 and 1.54 s. Find the mean, the mean absolute error and the percentage error.
The five readings add up to 1.52 + 1.49 + 1.55 + 1.50 + 1.54 = 7.60 s, so the mean is 7.60/5 = 1.52 s.
Absolute deviations from the mean: 0.00, 0.03, 0.03, 0.02, 0.02 s. Their mean is 0.10/5 = 0.02 s.
Relative error = 0.02/1.52, about 0.013, that is about 1.3%.
Answer: T = 1.52 ± 0.02 s, a percentage error of about 1.3%.
Example 2: Errors in a sum and a difference
(a) Resistors of 100 ± 3 Ω and 200 ± 4 Ω are joined in series. (b) Two temperatures are 56.3 ± 0.5 °C and 25.4 ± 0.5 °C. Find the total resistance and the temperature difference, with their errors.
(a) R = 300 Ω, ΔR = 3 + 4 = 7 Ω: 300 ± 7 Ω.
(b) The difference is θ1 − θ2 = 56.3 − 25.4 = 30.9 °C, with error 0.5 + 0.5 = 1.0 °C: 30.9 ± 1.0 °C.
Answer: 300 ± 7 Ω and 30.9 ± 1.0 °C. The difference has a relative error of about 3.2%, much more than the 0.9% of 56.3 °C.
Example 3: Error in a quotient
A voltage of 5.0 ± 0.1 V drives a current of 0.20 ± 0.01 A through a resistor. Find its resistance with the error.
R = V/I = 5.0/0.20 = 25 Ω. Relative error = 0.1/5.0 + 0.01/0.20 = 0.02 + 0.05 = 0.07. ΔR = 0.07 × 25 = 1.75 Ω, about 2 Ω.
Answer: R ≈ (25 ± 2) Ω. The first-order calculation gives 7% before rounding; the displayed bound 2/25 corresponds to 8%. Quoting both without this distinction would be inconsistent.
Example 4: Error with a power
The density of a sphere is found from its mass m and diameter d: ρ = 6m/(πd). If m has an error of 1% and d of 2%, what is the error in ρ?
Δρ/ρ = Δm/m + 3Δd/d = 1% + 3 × 2% = 7%. The constants 6 and π carry no error.
Answer: 7%; the diameter, cubed, contributes most of it.
Example 5: Measuring g
In g = 4πL/T, L is measured to 0.5% and T to 1%. Find the percentage error in g.
Δg/g = ΔL/L + 2ΔT/T = 0.5% + 2 × 1% = 2.5%.
Answer: about 2.5%. Reducing the relative timing uncertainty by one percentage point reduces this estimate by two percentage points; the same reduction in relative length uncertainty reduces it by one.
Common mistakes to avoid
Common mistake
Subtracting errors in a difference or quotient
For Z = A − B the absolute errors add: ΔZ = ΔA + ΔB. For Z = A/B the relative errors add: ΔZ/Z = ΔA/A + ΔB/B. The worst case is that both errors push the result the same way.
Common mistake
Forgetting the power
In A, the relative error is three times that of A. In √A it is half.
Common mistake
Averaging signed deviations
The deviations from the mean add up to zero. The mean absolute error averages their sizes, |Δak|.
Common mistake
Confusing accuracy with precision
A fine scale gives good resolution, not proof of repeatability. Repeated readings can cluster tightly yet be biased. Averaging independent readings can reduce the random contribution to the mean but cannot remove a common calibration bias.
Common mistake
Quoting errors to too many figures
An error is itself uncertain; give it to one or two significant figures (25 ± 2 Ω, not 25 ± 1.75 Ω), and round the result to match.
Quick revision summary
- Error = measured value − reference value. Accuracy: closeness to the reference; precision: agreement of repeated readings; resolution: smallest distinguishable change.
- Correct known systematic biases. Averaging independent readings reduces the random contribution to the mean, not every uncertainty.
- Δak is a signed deviation from the mean; |Δak| is its magnitude. Mean absolute deviation describes scatter.
- Mean amean; mean absolute error Δamean; relative error Δamean/amean; percentage error = relative error × 100%.
- For separate input bounds, add absolute bounds for sums and differences. For small relative uncertainties, approximate product/quotient bounds by adding relative bounds; multiply each contribution by the exponent’s magnitude. The formula sheet uses positive inputs and non-negative p, q, r.
Formula sheet
- amean = (a1 + a2 + … + an)/n
- Δamean = (|Δa1| + |Δa2| + … + |Δan|)/n
- relative error = Δamean/amean; percentage error = relative error × 100%
- Z = A ± B: ΔZ = ΔA + ΔB
- Z = AB or A/B: ΔZ/Z = ΔA/A + ΔB/B
- Z = Ap Bq/Cr: ΔZ/Z = pΔA/A + qΔB/B + rΔC/C
Questions students ask
What are the types of errors in measurement?
Errors in measurement are of three main kinds, systematic errors, random errors and the least count error, and many books add gross errors. Systematic effects produce constant or predictable biases; random effects produce scatter. Resolution also contributes uncertainty. These are not three mutually exclusive categories: one instrument can have all these limitations. Gross errors are blunders, such as misreading a scale, and are avoided by care rather than treated with statistics.
Do absolute, relative and percentage errors have units?
An error or uncertainty expressed as an absolute size has the quantity’s unit, as in T = 2.04 ± 0.03 s. A relative size is divided by the magnitude of the non-zero reference or measured value, so it is dimensionless. The percentage is that ratio times 100%: here 0.03/2.04 ≈ 0.015, or about 1.5%. State whether the ± value is an uncertainty estimate or an error relative to a known reference.
How do you calculate the percentage error when the true value is known?
When a true or accepted value is known, the percentage error is |measured value − true value| ÷ true value × 100%. For example, a student who finds g = 9.62 m s against the accepted 9.80 m s has a percentage error of 0.18/9.80 × 100% ≈ 1.8%. Without a known reference, the actual percentage error cannot be calculated. A school exercise may instead ask for relative mean absolute deviation: divide the mean absolute deviation by the magnitude of the non-zero mean and multiply by 100%.
Are errors always added, or combined as the square root of the sum of squares?
Use the uncertainty model stated in the problem. Small worst-case relative bounds of 3% and 4% give about 7% for a product; the exact upper change is 1.03 × 1.04 − 1 = 7.12%. If instead 3% and 4% are uncorrelated relative standard uncertainties, the first-order combination is √(3 + 4)% = 5%. Bounds and standard uncertainties are different inputs, so 7% and 5% are not competing answers to the same specification. Beyond NCERT: NIST Technical Note 1297, Appendix A, describes standard-uncertainty propagation and covariance.
Is error analysis still in the JEE Main and NEET syllabus?
Yes, error analysis is still in both syllabuses: Unit 1 of the JEE Main 2027 and NEET (UG) 2026 syllabuses lists “least count, significant figures, Errors in measurements” alongside units and dimensions. Students sometimes think it was dropped because the current NCERT Class 11 book (2026–27) has no section on it; the book only touches relative error and the combination of errors in a product, in Section 1.3.3.
Practice questions
Try each question first, then open the answer to check your working.
-
Q1. How can you reduce (a) random errors and (b) systematic errors?
Show answerHide answer
(a) Repeat the measurement many times and take the mean. (b) Find the cause and correct for it, for example by allowing for zero error, calibrating the instrument or improving the method; repetition does not help.
-
Q2. The side of a cube is measured with a 1% error. What is the percentage error in its volume?
Show answerHide answer
V = a, so the relative error is 3 × 1% = 3%.
-
Q3. Why does subtracting two nearly equal measured quantities give a poor result?
Show answerHide answer
The absolute errors add, but the difference itself is small, so the relative error of the result becomes large.