Variance and standard deviation
NCERT Class 11 Mathematics Chapter 13 Section 13.5
Quick answer
The variance is the mean of the squared deviations from the mean, σ = (1/n) Σ(x − x̄), and the standard deviation σ is its non-negative square root, in the same units as the data. A quicker form for a frequency table is σ = (1/N) Σfx − x̄, the mean of the squares minus the square of the mean. Adding a constant to every value leaves σ unchanged, while multiplying every value by k multiplies σ by |k|.
With your textbook
NCERT Mathematics (Class 11), Chapter 13 “Statistics”, Section 13.5 “Variance and Standard Deviation”, pages 271–282.
Open the official NCERT chapter (PDF, 2.9 MB, ncert.nic.in) (opens in a new tab)
Checked against the 2026-27 reprint on .
What are the variance and the standard deviation?
Variance and standard deviation
This number, i.e., mean of the squares of the deviations from mean is called the variance
NCERT Mathematics (Class 11), Section 13.5, page 273
For this reason, the proper measure of dispersion about the mean of a set of observations is expressed as positive square-root of the variance and is called standard deviation.
NCERT Mathematics (Class 11), Section 13.5.1, page 274
- Variance: σ2 = (1/n) Σ(xi − x̄)2, read “sigma squared”.
- Standard deviation: σ = √(variance), the non-negative square root.
In plain words: square each deviation from the mean, take the mean of the squares, and you have the variance. Its units are the square of the data’s units (marks squared, cm2), so its square root, the standard deviation, is used to describe spread in the data’s own units. Roughly, σ is a typical distance of the values from the mean: the larger it is, the more scattered the data.
Why squares, and why their mean?
The deviations from the mean add up to 0, so they cannot simply be averaged. Squaring makes every term non-negative, as the modulus does for the mean deviation, and a square is easy to handle algebraically. If Σ(xi − x̄)2 is 0, every deviation is 0 and all the values are equal: there is no dispersion at all.
But the sum of the squared deviations on its own is not enough. NCERT (pages 272–273) compares two sets with mean 30:
- Set A: the 6 values 5, 15, 25, 35, 45, 55. Sum of squared deviations 625 + 225 + 25 + 25 + 225 + 625 = 1750.
- Set B: the 31 values 15, 16, …, 45. Sum of squared deviations 2(12 + 22 + … + 152) = 2 × (15 × 16 × 31)/6 = 2480, using the sum of the squares of the first n natural numbers, n(n + 1)(2n + 1)/6, which NCERT quotes here.
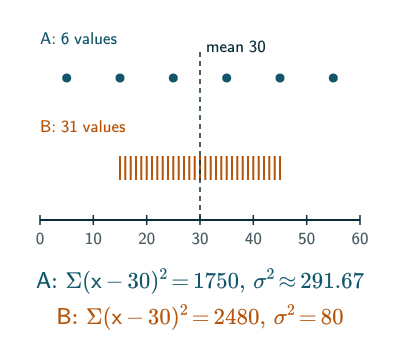
Thus, we can say that the sum of squares of deviations from the mean is not a proper measure of dispersion.
NCERT Mathematics (Class 11), Section 13.5, page 273
Dividing by the number of values fixes this: 1750/6 ≈ 291.67 for A and 2480/31 = 80 for B, so A is more scattered, as the picture shows. This mean of the squares is the variance.
Variance and standard deviation
σ = (1/n) Σ(x − x̄)
σ = √[(1/n) Σ(x − x̄)]
NCERT divides by n; use n in JEE Main too, unless a question asks for the sample variance. Some calculators and books divide by n − 1 when the data are a sample from a larger population; that gives a slightly larger value and is not used here.
Ungrouped data
NCERT Example 8 (pages 274–275). Find the variance of 6, 8, 10, …, 24. With the assumed mean 14 and step 2, the step deviations −4, −3, …, 5 add up to 5, so x̄ = 14 + 2 × 5/10 = 15.
| xi | xi − 15 | (xi − 15)2 |
|---|---|---|
| 6, 24 | −9, 9 | 81 each |
| 8, 22 | −7, 7 | 49 each |
| 10, 20 | −5, 5 | 25 each |
| 12, 18 | −3, 3 | 9 each |
| 14, 16 | −1, 1 | 1 each |
The squares add up to 2(81 + 49 + 25 + 9 + 1) = 330, so σ2 = 330/10 = 33 and σ = √33 ≈ 5.74.
Frequency distributions
When xi occurs fi times, each squared deviation is counted fi times, and N = Σfi:
Variance of a frequency distribution
σ = (1/N) Σf(x − x̄)
NCERT Example 9 (pages 275–276). For xi = 4, 8, 11, 17, 20, 24, 32 with frequencies 3, 5, 9, 5, 4, 3, 1, N = 30 and Σfixi = 420, so x̄ = 14.
| xi | fi | (xi − 14)2 | fi(xi − 14)2 |
|---|---|---|---|
| 4 | 3 | 100 | 300 |
| 8 | 5 | 36 | 180 |
| 11 | 9 | 9 | 81 |
| 17 | 5 | 9 | 45 |
| 20 | 4 | 36 | 144 |
| 24 | 3 | 100 | 300 |
| 32 | 1 | 324 | 324 |
The last column adds up to 1374, so σ2 = 1374/30 = 45.8 and σ = √45.8 ≈ 6.77.
The given continuous frequency distribution can be represented as a discrete frequency distribution by replacing each class by its mid-point.
NCERT Mathematics (Class 11), Section 13.5.3, page 276
Replacing classes by mid-points gives an estimate of the original data’s variance, because variation within each class is unknown.
NCERT Example 10 (pages 277–278). Classes 30–40, 40–50, …, 90–100 with frequencies 3, 7, 12, 15, 8, 3, 2. The mid-points are 35, 45, …, 95, N = 50 and Σfixi = 3100, so x̄ = 62. The values fi(xi − 62)2 are 2187, 2023, 588, 135, 1352, 1587, 2178, a total of 10 050. So σ2 = 10 050/50 = 201 and σ = √201 ≈ 14.18.
A quicker formula
Expanding the square avoids working out every deviation. Since Σfixi = Nx̄ and Σfi = N,
(1/N) Σfi(xi − x̄)2
= (1/N) Σfixi2 − 2x̄ × (1/N) Σfixi + x̄2
= (1/N) Σfixi2 − 2x̄ × x̄ + x̄2
= (1/N) Σfixi2 − x̄2.
So the variance is the mean of the squares minus the square of the mean. Putting x̄ = (Σfixi)/N gives NCERT’s formula (3) (page 277):
Variance from the sums
σ = (1/N) Σfx − x̄
σ = (1/N) √[NΣfx − (Σfx)]
NCERT Example 11 (pages 278–279). For xi = 3, 8, 13, 18, 23 with frequencies 7, 10, 15, 10, 6: N = 48, Σfixi = 614 and Σfixi2 = 9652. Then 48 × 9652 − 6142 = 463 296 − 376 996 = 86 300, and σ = (1/48)√86 300 ≈ 293.77/48 ≈ 6.12.
Step deviations
When the values are large, take an assumed mean A and a positive step h (often the class width), and use yi = (xi − A)/h, so xi = A + hyi. Then x̄ = A + hȳ, and every deviation xi − x̄ = h(yi − ȳ) is h times the deviation in y (NCERT pages 279–280):
Step deviations
x̄ = A + h × (Σfiyi)/N
σx2 = h2σy2, so σx = hσy
σx2 = (h2/N2)[NΣfiyi2 − (Σfiyi)2]
Applying the quicker formula to the yi gives the last line, the square of NCERT’s formula (5) on page 280.
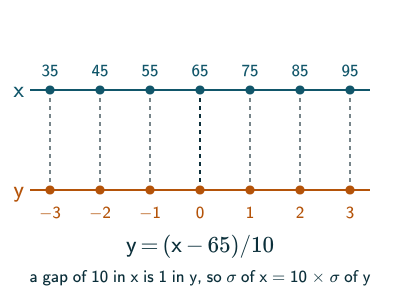
NCERT Example 12 (pages 280–281). For the data of Example 10, take A = 65 and h = 10. Then yi = −3, −2, …, 3, Σfiyi = −15 and Σfiyi2 = 105, so
x̄ = 65 + 10 × (−15/50) = 62,
σ2 = (100/2500)(50 × 105 − 225) = 201,
as before. NCERT introduces this example with “Let us solve Example 11 by the short-cut method” (page 280), but Example 12 uses the data of Example 10, not Example 11; its answers, 62 and 201, are those of Example 10.
Shifting and scaling
- Adding a constant c to every value adds c to the mean, so every deviation, and hence the variance, is unchanged (NCERT Miscellaneous Example 15, page 284).
- Multiplying every value by k multiplies the mean and every deviation by k, so the variance is multiplied by k2 and the standard deviation by |k|. In NCERT Miscellaneous Example 13 (pages 282–283), 20 values with variance 5 are doubled, and the new variance is 22 × 5 = 20.
Shifting and scaling
y = kx + c: ȳ = kx̄ + c
σy2 = k2σx2
σy = |k|σx
Mean deviation is at most σ (JEE)
For any data, the mean deviation about the mean is never more than the standard deviation. Write di = xi − x̄, and let m = (1/n) Σ|di|, the mean deviation about the mean. Since |di|2 = di2, the mean of (|di| − m)2 is σ2 − 2m × m + m2 = σ2 − m2, and a mean of squares cannot be negative. So m ≤ σ, with equality only when every value is the same distance from the mean.
Working with Σx and Σx (JEE)
Many problems give the mean and the variance instead of the data. Since x̄ = Σxi/n and σ2 = Σxi2/n − x̄2, you can recover the two sums, correct or extend them, and recompute. To combine two groups, add their Σx and their Σx2, then recompute:
Recovering the sums
Σx = nx̄, Σx = n(σ + x̄)
NCERT Miscellaneous Example 16 (pages 284–286). 100 observations were found to have mean 40 and standard deviation 5.1, but one value 40 had been read as 50. The wrong sums are Σx = 4000 and Σx2 = 100(26.01 + 1600) = 162 601. Correcting them gives Σx = 4000 − 50 + 40 = 3990 and Σx2 = 162 601 − 2500 + 1600 = 161 701. So the correct mean is 39.9, and
σ2 = 1617.01 − 39.92
= 1617.01 − 1592.01 = 25,
so the correct standard deviation is 5.
NCERT Miscellaneous Example 14 (pages 283–284). Five observations have mean 4.4 and variance 8.24, and three of them are 1, 2, 6. If the other two are x and y, the mean gives x + y = 22 − 9 = 13. The sum of squares is 5(8.24 + 4.42) = 138, so x2 + y2 = 138 − 41 = 97. Then 2xy = 132 − 97 = 72, (x − y)2 = 97 − 72 = 25, and the two observations are 4 and 9.
Solved examples
Example 1: A list (NCERT Exercise 13.2, Q1)
Find the mean and variance of 6, 7, 10, 12, 13, 4, 8, 12.
The mean is 72/8 = 9. The deviations −3, −2, 1, 3, 4, −5, −1, 3 have squares 9, 4, 1, 9, 16, 25, 1, 9, which add up to 74.
Answer: mean 9, variance 74/8 = 9.25.
Example 2: The first n natural numbers (NCERT Exercise 13.2, Q2)
Find the mean and variance of 1, 2, …, n.
The mean is (1/n) × n(n + 1)/2 = (n + 1)/2, from the sum of the first n natural numbers. The mean of the squares is (n + 1)(2n + 1)/6. Subtracting the square of the mean, (n + 1)2/4, and taking out the common factor (n + 1)/12 leaves σ2 = (n + 1)(n − 1)/12.
Answer: mean (n + 1)/2, variance (n2 − 1)/12.
Example 3: A frequency table (NCERT Exercise 13.2, Q4)
Find the mean and variance for xi = 6, 10, 14, 18, 24, 28, 30 with frequencies 2, 4, 7, 12, 8, 4, 3.
N = 40 and Σfixi = 760, so x̄ = 19. The squared deviations 169, 81, 25, 1, 25, 81, 121 times the frequencies give 338, 324, 175, 12, 200, 324, 363, a total of 1736.
Answer: mean 19, variance 1736/40 = 43.4.
Example 4: Grouped data by step deviations (NCERT Exercise 13.2, Q7)
Classes 0–30, 30–60, …, 180–210 have frequencies 2, 3, 5, 10, 3, 5, 2. Find the mean and variance.
The mid-points are 15, 45, …, 195. With A = 105 and h = 30, yi = −3, …, 3, N = 30, Σfiyi = 2 and Σfiyi2 = 76. So x̄ = 105 + 30 × 2/30 = 107, and
σ2 = (900/900)(30 × 76 − 22) = 2276.
Answer: mean 107, variance 2276.
Example 5: Two missing observations (NCERT Miscellaneous Exercise, Q1)
Eight observations have mean 9 and variance 9.25. Six of them are 6, 7, 10, 12, 12, 13. Find the other two.
Σx = 72, so x + y = 72 − 60 = 12. Σx2 = 8(9.25 + 81) = 722, and the six known squares add up to 642, so x2 + y2 = 80. Then 2xy = 144 − 80 = 64 and (x − y)2 = 80 − 64 = 16.
Answer: 4 and 8.
Example 6: Scaling (NCERT Miscellaneous Exercise, Q3)
Six observations have mean 8 and standard deviation 4. Each is multiplied by 3. Find the new mean and standard deviation.
Both are multiplied by 3.
Answer: mean 24, standard deviation 12.
Example 7: A linear change
The variance of x is 9. Find the standard deviation of 3 − 2x.
The 3 changes nothing; the factor −2 multiplies the standard deviation 3 by |−2|.
Answer: 6.
Common mistakes to avoid
Common mistake
Forgetting the square root
The variance is σ2; the standard deviation is its square root. Read the question for which one it asks.
Common mistake
Squaring the sum instead of summing the squares
Σfixi2 means square each value, multiply by its frequency, then add. It is not (Σfixi)2.
Common mistake
Dropping the frequencies or the h
With step deviations, σx2 = h2σy2. Forgetting the h2, or using h instead, gives a wrong variance. In a frequency table, multiply each square by fi and divide by N, not by the number of rows.
Common mistake
Thinking that adding a constant changes the spread
Adding c to every value moves the mean by c and leaves the variance alone. Only multiplying changes it, by k2.
Common mistake
A negative variance
The variance is a mean of squares, so it can never be negative. If the quicker formula gives a negative number, check the arithmetic and rounding: subtracting nearly equal rounded numbers can also produce a small negative result. Recompute with full precision or directly average squared deviations.
Quick revision summary
- The variance is the mean of the squared deviations from the mean, σ = (1/n) Σ(x − x̄), and the standard deviation σ is its non-negative square root, in the data’s units.
- For a frequency table, σ = (1/N) Σf(x − x̄); for grouped data, use the class mid-points.
- Quicker: σ = (1/N) Σfx − x̄, the mean of the squares minus the square of the mean.
- Step deviations yi = (xi − A)/h give x̄ = A + hȳ and σx = hσy.
- Adding c leaves the variance unchanged; multiplying by k multiplies the variance by k2 and σ by |k|.
- Σxi = nx̄ and Σxi2 = n(σ2 + x̄2) let you correct or extend data from the mean and variance alone.
Formula sheet
- σ = (1/n) Σ(x − x̄)
- σ = (1/N) Σf(x − x̄)
- σ = (1/N) Σfx − x̄
- σ = (1/N) √[NΣfx − (Σfx)]
- yi = (xi − A)/h, h > 0: x̄ = A + hȳ, σx = hσy
- y = kx + c: σy2 = k2σx2, σy = |k|σx
- Σx = nx̄, Σx = n(σ + x̄)
Questions students ask
What is the difference between variance and standard deviation?
The variance σ2 and the standard deviation σ measure the same spread, since σ is the non-negative square root of the variance, but in different units: the variance is in the square of the data’s units, σ in the data’s own units. So σ is the one quoted to describe spread (heights with variance 49 cm2 have σ = 7 cm, which can be read against the heights themselves), while the variance is the one used in algebra. For example, Σxi2 = n(σ2 + x̄2) lets you correct or combine data, and multiplying every value by k multiplies the variance by k2 but σ by |k|.
What is the difference between standard deviation and mean deviation?
The mean deviation averages the distances |xi − a| from the mean or the median, while the standard deviation squares the deviations from the mean, averages the squares and takes the square root. Both are in the data’s units, but squaring gives large deviations more weight, so σ is never less than the mean deviation about the mean (proof). The standard deviation is usually preferred because squares are easy to handle in algebra: the variance of combined or corrected data follows from Σx and Σx2, while absolute values have no such shortcut.
What is the coefficient of variation, and how does it compare variability?
The coefficient of variation is the standard deviation as a percentage of the mean, CV = (σ/x̄) × 100, used for data with a positive mean and a meaningful zero (such as lengths or masses, but not Celsius temperatures); it has no units, so it compares the variability of data sets with different means or in different units. The set with the smaller CV is the more consistent: a batsman averaging 40 runs with σ = 10 has CV 25%, while one averaging 60 with σ = 12 has CV 20%, so the second batsman is more consistent although that σ is larger. The coefficient of variation is not in the current NCERT Class 11 book (2026–27 reprint), and the JEE Main syllabus (Unit 13) does not name it.
Why do some variance formulas divide by n − 1 instead of n?
For n > 1, dividing by n − 1 gives the usual sample variance, used when the data are a sample and the aim is to estimate the variance of a larger population; NCERT Class 11 divides by n, treating the data as the whole set. The reason is that the deviations are measured from the sample’s own mean, the value of a that makes Σ(xi − a)2 smallest, so dividing that sum by n tends to underestimate the population variance, and dividing by n − 1 (Bessel’s correction) removes this bias for independent observations from the same population with finite variance. For 2, 4, 9 the mean is 5 and the squared deviations add up to 26, so the variance is 26/3 ≈ 8.67 with n but 13 with n − 1.
How do you find the combined variance of two groups?
To find the combined variance of two groups, recover each group’s sums from Σx = nx̄ and Σx2 = n(σ2 + x̄2), add them, and use σ2 = Σx2/N − x̄2 for all N values together. For 15 values with mean 12 and variance 6 and 25 values with mean 20 and variance 10, Σx is 180 and 500 (total 680, so the combined mean is 17) and Σx2 is 2250 and 10 250 (total 12 500). The combined variance is 12 500/40 − 172 = 312.5 − 289 = 23.5, not the average of the two variances: it is their weighted mean, 8.5, plus 15 for the gap between the two means.
Practice questions
Try each question first, then open the answer to check your working.
-
Q1. Find the mean and variance of the first 10 multiples of 3 (NCERT Exercise 13.2, Q3).
Show answerHide answer
They are 3 × 1, …, 3 × 10. The mean is 3 × 5.5 = 16.5, and by Example 2 with n = 10 the variance is 32 × 99/12 = 74.25.
-
Q2. Find the mean and variance for classes 0–10, 10–20, 20–30, 30–40, 40–50 with frequencies 5, 8, 15, 16, 6 (NCERT Exercise 13.2, Q8).
Show answerHide answer
Mid-points 5, 15, 25, 35, 45; N = 50, Σfixi = 1350 and Σfixi2 = 43 050. Mean 27; variance 43 050/50 − 272 = 861 − 729 = 132.
-
Q3. Seven observations have mean 8 and variance 16. Five of them are 2, 4, 10, 12, 14. Find the other two (NCERT Miscellaneous Exercise, Q2).
Show answerHide answer
x + y = 56 − 42 = 14, and x2 + y2 = 7(16 + 64) − 460 = 100. Then 2xy = 196 − 100 = 96 and (x − y)2 = 4, so the two observations are 6 and 8.
-
Q4. Can a variance be negative? When is it 0?
Show answerHide answer
No: it is a mean of squares. It is 0 only when every deviation is 0, that is, when all the values are equal.