Measures of dispersion
NCERT Class 11 Mathematics Chapter 13 Section 13.2
Quick answer
A measure of dispersion is one number for how scattered data are around a central value: the range, the quartile deviation QD = (Q − Q)/2, the mean deviation and the standard deviation. Deviations from the mean add up to 0, so the mean deviation averages their sizes and the standard deviation uses their squares.
With your textbook
NCERT Mathematics (Class 11), Chapter 13 “Statistics”, Section 13.2 “Measures of Dispersion”, page 259.
Open the official NCERT chapter (PDF, 2.9 MB, ncert.nic.in) (opens in a new tab)
Checked against the 2026-27 reprint on .
What is dispersion?
Measure of dispersion
Like ‘measures of central tendency’ we want to have a single number to describe variability. This single number is called a ‘measure of dispersion’.
NCERT Mathematics (Class 11), Section 13.1, page 258
The dispersion or scatter in a data is measured on the basis of the observations and the types of the measure of central tendency, used there.
NCERT Mathematics (Class 11), Section 13.2, page 259
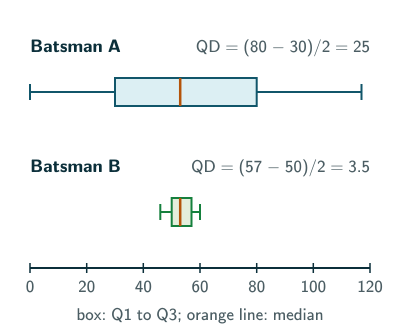
In plain words: a measure of central tendency says where the data sit; a measure of dispersion says how widely they are spread around that point. NCERT’s two batsmen (page 257) both average 53 runs, but A’s scores swing from 0 to 117 while B’s stay between 46 and 60. A single number that is large for A and small for B is what we want.
The four measures
NCERT lists four measures of dispersion (page 259): (i) range, (ii) quartile deviation, (iii) mean deviation and (iv) standard deviation.
In this Chapter, we shall study all of these measures of dispersion except the quartile deviation.
NCERT Mathematics (Class 11), Section 13.2, page 259
Worked out for the two batsmen (NCERT gives only the ranges; the standard deviation divides by n, as NCERT does):
| Measure | Batsman A | Batsman B |
|---|---|---|
| Range | 117 | 14 |
| Quartile deviation | 25 | 3.5 |
| Mean deviation about the mean | 31.6 | 3.2 |
| Standard deviation | 36.06 | 4.17 |
Every measure says the same thing: B is far more consistent. They differ in how much of the data they use. The range looks only at the largest and smallest values, the quartile deviation at the middle half, and the mean and standard deviations at every value.
Why the deviations need sizes or squares
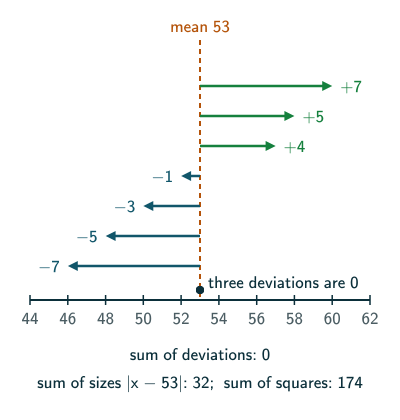
The natural idea is to average the deviations xi − x̄ from the mean. But they always add up to 0, because the values above the mean balance those below it (NCERT page 259):
Thus, finding the mean of deviations about mean is not of any use for us, as far as the measure of dispersion is concerned.
NCERT Mathematics (Class 11), Section 13.4, page 259
There are two ways out. Take the size of each deviation, |xi − x̄|, using the modulus function, and average those: the mean deviation. Or square each deviation and average the squares (the variance), then take the square root: the standard deviation.
Quartile deviation (beyond NCERT)
This measure is beyond NCERT and not named in the JEE Main syllabus, but useful to know. The quartiles split the sorted data into four equal parts (Q2 is the median). In one common method, Q1 is the median of the lower half and Q3 the median of the upper half; with an odd number of values, leave the middle value out of both halves. Other books use slightly different positions, and for small data sets this can change the answer noticeably: the (n + 1)/4-th-value rule gives batsman A a QD of 29.5 instead of 25. The quartile deviation is half the spread of the middle half of the data:
Quartile deviation
QD = (Q − Q)/2
For batsman A, sorted: 0, 5, 30, 30, 42 | 64, 71, 80, 91, 117. So Q1 = 30, Q3 = 80 and QD = 25. For B: Q1 = 50, Q3 = 57 and QD = 3.5. Moving an existing minimum farther down or an existing maximum farther up leaves these quartiles unchanged. Quartiles are generally less sensitive to extremes than the range, though changing observations can affect them, especially in small data sets.
Shifting and scaling (JEE). Adding the same number to every value moves the data without spreading them, so the absolute measures listed here do not change. Relative coefficients can change because their denominators involve the centre. Multiplying every value by k multiplies the range, the quartile deviation, the mean deviation and the standard deviation by |k|, and the variance by k2.
Solved examples
Example 1: Deviations add up to zero
For 3, 7, 8 and 12, find the deviations from the mean and their sum.
The mean is 30/4 = 7.5, and the deviations are −4.5, −0.5, 0.5 and 4.5.
Answer: they add up to 0, as they must.
Example 2: Mean deviation of batsman B
Find the mean of the sizes of B’s deviations from 53.
The sizes are 0, 7, 5, 3, 0, 0, 5, 7, 4 and 1, which add up to 32.
Answer: 32/10 = 3.2 runs.
Example 3: Quartile deviation
Find the range and the quartile deviation of 2, 4, 4, 5, 7, 9, 10, 12.
The range is 12 − 2 = 10. The lower half 2, 4, 4, 5 has median 4 and the upper half 7, 9, 10, 12 has median 9.5.
Answer: range 10, QD = (9.5 − 4)/2 = 2.75.
Example 4: Which batsman is steadier?
Using the table above, which batsman would you pick for consistency?
Answer: batsman B: every measure of dispersion is far smaller for B, although both average 53.
Example 5: A constant added and a scale factor
The scores of a test have range 30 and quartile deviation 6. Every score is doubled and then 5 is added. Find the new range and quartile deviation.
Adding 5 changes nothing; doubling multiplies both by 2.
Answer: range 60, QD 12.
Example 6: The range and one extreme value
Find the range and QD of 20, 22, 23, 25, 26, 28, and again after replacing 28 by 80.
First: range 8; Q1 = 22 and Q3 = 26, so QD = 2. Second: range 60, but the quartiles are unchanged.
Answer: the range jumps from 8 to 60, while the QD stays 2.
Common mistakes to avoid
Common mistake
Averaging the signed deviations
The deviations from the mean always add up to 0, whatever the data. Use their sizes or their squares.
Common mistake
Thinking a larger mean means more spread
Dispersion is about scatter around the centre, not about the centre itself. Adding 100 to every score raises the mean by 100 and leaves the range, QD, mean deviation, variance and standard deviation unchanged.
Common mistake
Forgetting to halve for the quartile deviation
The quartile deviation is (Q3 − Q1)/2, not Q3 − Q1. The full difference is the interquartile range.
Common mistake
Comparing measures of different kinds
A mean deviation of 3.2 and a standard deviation of 4.17 are not in conflict. Compare like with like: the same measure for both data sets.
Quick revision summary
- A measure of dispersion is a single number for how scattered the data are around a central value.
- The four measures are the range, the quartile deviation, the mean deviation and the standard deviation; NCERT studies all except the quartile deviation.
- Deviations from the mean add up to 0, so the mean deviation uses their sizes and the standard deviation their squares.
- QD = (Q3 − Q1)/2. Adding a constant changes none of these absolute measures; multiplying by k multiplies the range, QD, mean deviation and standard deviation by |k| and the variance by k2.
Formula sheet
- range = maximum − minimum
- QD = (Q − Q)/2
- Σ(x − x̄) = 0
- adding a constant c: range, QD, MD, variance and SD unchanged
- multiplying by k: range, QD, MD, SD × |k|; variance × k
Questions students ask
What is the difference between absolute and relative measures of dispersion?
An absolute measure of dispersion describes spread on the data’s scale (variance uses squared units), while a relative measure is a pure number with no unit, usually an absolute measure divided by a central value. The range, the quartile deviation, the mean deviation and the standard deviation are absolute; relative measures include the coefficient of range, the coefficient of quartile deviation, (Q3 − Q1)/(Q3 + Q1), and the coefficient of variation. These ratios require non-zero denominators and an appropriate scale with a meaningful zero; for the usual non-negative data, require a positive denominator. Relative measures compare proportional spreads; none of them is in the 2026–27 NCERT book.
Which measure of dispersion is most affected by extreme values?
The range is highly sensitive to extreme values, because it uses only the largest and the smallest observations. The standard deviation also responds strongly because of squaring, while mean deviation uses absolute distances and quartile deviation uses the middle half. This describes their sensitivity; there is no universal ranking of the factors by which they change for every data set. For 2, 3, 4, 5, 6, 7, 8, 9, replacing 9 by 49 multiplies the range by about 6.7, the standard deviation by about 6.4 and the mean deviation about the mean by about 4.8, but leaves the quartile deviation unchanged.
What is the difference between dispersion and deviation?
Deviation and dispersion are different: a deviation belongs to one observation, its difference xi − a from a central value a such as the mean, while dispersion describes the whole data set and is summarised by one number built from the deviations, the quartiles or the extreme values. So a list of ten values has ten deviations from its mean but just one mean deviation, one variance and one standard deviation. The variance and the standard deviation are particular measures of dispersion, not other names for it: NCERT Section 13.5 builds them from the squared deviations (pages 271–274).
How do you find the quartile deviation of grouped data?
The quartile deviation of grouped data, also called the semi-interquartile range, is QD = (Q3 − Q1)/2, with each quartile found like the median of grouped data but using N/4 for Q1 and 3N/4 for Q3 in place of N/2. For classes 0–10, 10–20, 20–30, 30–40 with frequencies 2, 6, 10, 2, N = 20, so Q1 = 10 + (5 − 2)/6 × 10 = 15, Q3 = 20 + (15 − 8)/10 × 10 = 27 and QD = 6. Like the quartile deviation itself, this is beyond NCERT and not named in the JEE Main syllabus.
Which measures of dispersion are in the JEE Main syllabus?
The JEE Main syllabus (Unit 13, Statistics and Probability) lists “Measures of dispersion” and the “calculation of standard deviation, variance and mean deviation for grouped and ungrouped data”, so these three measures are named explicitly. The range is not named separately; since it is the first measure NCERT studies (Section 13.3), it is reasonable to read it as part of the general “Measures of dispersion” entry, though the syllabus does not say so. The quartile deviation is not named either, and NCERT lists it but does not study it, so it is safest to treat it as beyond the syllabus.
Practice questions
Try each question first, then open the answer to check your working.
-
Q1. Name the four measures of dispersion listed by NCERT, and the one the chapter does not study.
Show answerHide answer
Range, quartile deviation, mean deviation and standard deviation; the chapter leaves out the quartile deviation (NCERT page 259).
-
Q2. Find the deviations of 4, 6, 11 from their mean and show that they add up to 0.
Show answerHide answer
The mean is 7; the deviations −3, −1 and 4 add up to 0.
-
Q3. Find the quartile deviation of 4, 7, 8, 9, 10, 12, 13, 17 (NCERT Exercise 13.1, Q1 data).
Show answerHide answer
Lower half 4, 7, 8, 9 has median 7.5; upper half 10, 12, 13, 17 has median 12.5. QD = (12.5 − 7.5)/2 = 2.5.
-
Q4. Every value of a data set is multiplied by −3. What happens to its quartile deviation and its variance?
Show answerHide answer
The order of the values reverses, so Q1 and Q3 swap places, but the gap between them becomes three times as wide: the QD is multiplied by |−3| = 3. The variance is multiplied by (−3)2 = 9.