Range
NCERT Class 11 Mathematics Chapter 13 Section 13.3
Quick answer
The range of a data set is its maximum value minus its minimum value: range = maximum − minimum. NCERT’s batsman A has range 117 and batsman B only 14, so A is far less consistent. The range is quick to find but uses only two values, so one extreme value can change it completely.
With your textbook
NCERT Mathematics (Class 11), Chapter 13 “Statistics”, Section 13.3 “Range”, page 259.
Open the official NCERT chapter (PDF, 2.9 MB, ncert.nic.in) (opens in a new tab)
Checked against the 2026-27 reprint on .
What is the range?
Range
Thus, Range of a series = Maximum value – Minimum value.
NCERT Mathematics (Class 11), Section 13.3, page 259
In plain words: the range is the distance from the smallest value to the largest, the length of the smallest closed interval that holds all the data, from the minimum to the maximum. It is the simplest measure of dispersion and the quickest to find, and it is in the same units as the data.
The batsmen again
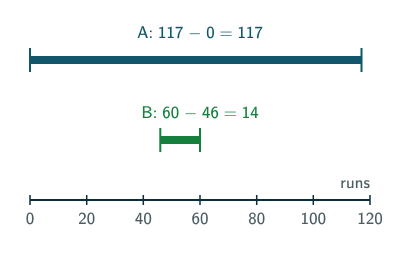
NCERT’s two batsmen (page 257) scored these runs in ten matches:
- A: 30, 91, 0, 64, 42, 80, 30, 5, 117, 71
- B: 53, 46, 48, 50, 53, 53, 58, 60, 57, 52
A’s runs go from 0 to 117 and B’s from 46 to 60. So the range is 117 − 0 = 117 for A and 60 − 46 = 14 for B (NCERT page 259):
Clearly, Range of A > Range of B. Therefore, the scores are scattered or dispersed in case of A while for B these are close to each other.
NCERT Mathematics (Class 11), Section 13.3, page 259
Range of frequency data (beyond NCERT)
- Discrete frequency table: the largest value with a non-zero frequency minus the smallest one. The frequencies themselves do not matter.
- Grouped data: the individual values are not known, so by convention take the upper boundary of the highest class minus the lower boundary of the lowest class, leaving out end classes with zero frequency. This class-boundary span is an upper bound, not the exact observed range; the actual extremes may lie inside those classes. Throughout this page, grouped-data “range” means this span.
- For classes 0–10, …, 50–60 the boundaries are the limits: 60 − 0 = 60.
- For inclusive classes such as 33–36, 37–40, …, 49–52 (NCERT Exercise 13.2, Q10), the continuous measurement boundaries in NCERT’s hint are 32.5 and 52.5, giving a class span of 20. If the data are exact integers, the greatest possible observed range is instead 52 − 33 = 19; do not confuse these quantities.
What the range misses
The range of data gives us a rough idea of variability or scatter but does not tell about the dispersion of the data from a measure of central tendency.
NCERT Mathematics (Class 11), Section 13.3, page 259
The range uses only two of the values. It says nothing about how the others are spread, and one unusual value can change it completely. That is why NCERT moves on to the mean deviation and the standard deviation, which use every observation.
Coefficient of range (beyond NCERT). To compare the spread of data on different scales, some books use (max − min)/(max + min), a pure number. Use it for non-negative data on a scale with a meaningful zero, with max + min > 0. It is undefined for an all-zero data set. For batsman B it is 14/106 ≈ 0.13.
Shifting and scaling (JEE). Adding a constant c to every value adds c to both the maximum and the minimum, so the range is unchanged. Multiplying every value by k multiplies both by k; if k is negative, the largest value becomes the smallest, so the new range is |k| × (max − min), never negative.
Solved examples
Example 1: A list (NCERT Exercise 13.1, Q2 data)
Find the range of 38, 70, 48, 40, 42, 55, 63, 46, 54, 44.
The largest value is 70 and the smallest 38.
Answer: 70 − 38 = 32.
Example 2: A discrete frequency table (NCERT Exercise 13.1, Q6 data)
Find the range of: xi = 10, 30, 50, 70, 90 with frequencies 4, 24, 28, 16, 8.
Answer: 90 − 10 = 80; the frequencies play no part.
Example 3: Grouped data (NCERT Exercise 13.2, Q7 data)
Classes 0–30, 30–60, …, 180–210 have frequencies 2, 3, 5, 10, 3, 5, 2. Find the range.
Answer: 210 − 0 = 210, from the limits of the end classes.
Example 4: One extreme value
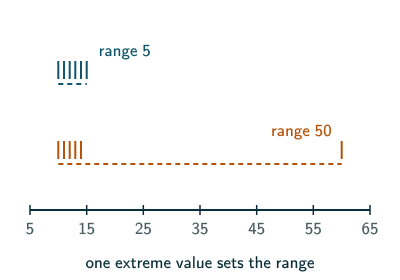
Find the range of 10, 11, 12, 13, 14, 15, and again with 15 replaced by 60.
Answer: 5, then 50: one value changes the range tenfold.
Example 5: A shifted and scaled data set
The range of a data set is 12. Find the range when every value is (i) increased by 7, (ii) multiplied by −2.
Answer: (i) 12; (ii) the order of the values reverses, and the range is |−2| × 12 = 24.
Example 6: Finding a missing value
The data 4, 9, x, 15 have range 14, and x is the largest value. Find x.
The smallest value is 4, so x − 4 = 14.
Answer: x = 18.
Common mistakes to avoid
Common mistake
Subtracting the first value from the last
The range is maximum − minimum, whatever their positions in the list. For 38, 70, 48, …, 44 it is 70 − 38, not 44 − 38.
Common mistake
Using frequencies
In a frequency table the range comes from the values, not from the frequencies.
Common mistake
Reading a small range as a small mean
The range describes spread, not size: 1000, 1001, 1002 has range 2.
Common mistake
Trusting the range when there is an extreme value
One unusual value can make the range large while the rest of the data are close together. Check with a measure that uses all the values.
Quick revision summary
- Range = maximum value − minimum value, in the same units as the data.
- Batsman A’s range is 117 and B’s is 14: A’s scores are far more scattered.
- For grouped data, use the upper boundary of the last class minus the lower boundary of the first (for inclusive classes, make them continuous first).
- The range uses only two values and is easily upset by one extreme value; it does not measure spread about a centre.
Formula sheet
- range = maximum − minimum
- grouped class span: upper boundary of last occupied class − lower boundary of first occupied class
- coefficient of range = (max − min)/(max + min), max + min > 0 (beyond NCERT)
- adding a constant c: range unchanged; multiplying by k: range × |k|
Questions students ask
What is the difference between range and coefficient of range?
The range is an absolute measure of spread, maximum − minimum, in the same units as the data, while the coefficient of range, (max − min)/(max + min), is a pure number with no units, so it can compare data on different scales. Pen prices from ₹10 to ₹30 have range ₹20 and coefficient 20/40 = 0.5, while phone prices from ₹9000 to ₹11 000 have range ₹2000 but coefficient 2000/20 000 = 0.1, so relative to their size the pen prices vary far more, although their range is a hundred times smaller. The coefficient of range is beyond NCERT and is meant for non-negative data with a meaningful zero and a positive max + min; it is undefined if all values are zero.
Why is the range important in statistics, and where is it used?
The range is important as the quickest first measure of spread: it needs only the largest and smallest values, and it is in the data’s own units. It is used where the extremes themselves matter, such as a day’s highest and lowest temperatures, a share’s high and low prices, or quality-control charts that track the range of small samples taken from a machine. Because it ignores every value in between, it is best read alongside a measure that uses all the data, such as the mean deviation.
What is the difference between range and standard deviation?
The range and the standard deviation both measure spread in the data’s own units, but the range uses only the largest and smallest values, while the standard deviation uses every observation: it is the square root of the variance, the mean of the squared deviations from the mean. So the range says how wide the data stretch from end to end, and the standard deviation how far the values typically lie from the mean. The range is quicker to find; the standard deviation is the measure used for further work, such as comparing consistency or correcting and combining data.
What is the difference between range and interquartile range?
The range, maximum − minimum, is the spread of all the data, while the interquartile range, Q3 − Q1, is the spread of the middle half of the sorted data, between the lower and upper quartiles. Because the quartiles depend only on the values near the quarter points, one extreme value can change the range completely but hardly moves the interquartile range. Half of the interquartile range is the quartile deviation; neither is studied in NCERT Class 11 or named in the JEE Main syllabus.
Practice questions
Try each question first, then open the answer to check your working.
-
Q1. Find the range of 4, 7, 8, 9, 10, 12, 13, 17 (NCERT Exercise 13.1, Q1 data).
Show answerHide answer
17 − 4 = 13.
-
Q2. Find the range of 13, 17, 16, 14, 11, 13, 10, 16, 11, 18, 12, 17 (NCERT Exercise 13.1, Q3 data).
Show answerHide answer
18 − 10 = 8.
-
Q3. Find the range of heights grouped as 95–105, 105–115, …, 145–155 cm (NCERT Exercise 13.1, Q10 data).
Show answerHide answer
155 − 95 = 60 cm.
-
Q4. The minimum of a data set is 23 and its range is 41. Find the maximum.
Show answerHide answer
23 + 41 = 64.