Mean deviation
NCERT Class 11 Mathematics Chapter 13 Section 13.4
Quick answer
The mean deviation about a central value a is the average distance of the observations from a: M.D.(a) = (1/n) Σ|x − a| for a list, and M.D.(a) = (1/N) Σf|x − a| for a frequency table, with each class at its mid-point for grouped data. It is usually taken about the mean or the median. For the same observations, the sum of the distances is least about their median, so the mean deviation about the median is never more than the mean deviation about the mean.
With your textbook
NCERT Mathematics (Class 11), Chapter 13 “Statistics”, Section 13.4 “Mean Deviation”, pages 259–271.
Open the official NCERT chapter (PDF, 2.9 MB, ncert.nic.in) (opens in a new tab)
Checked against the 2026-27 reprint on .
What is the mean deviation?
Mean deviation
Thus mean deviation about a central value ‘a’ is the mean of the absolute values of the deviations of the observations from ‘a’.
NCERT Mathematics (Class 11), Section 13.4, page 260
- It is written M.D.(a). For n observations, M.D.(a) = (1/n) Σ|xi − a|.
- The two usual choices of a are the mean x̄ and the median M, giving M.D.(x̄) and M.D.(M).
In plain words: the mean deviation is the average distance of the observations from a central value. If the mean deviation of a set of marks about its mean is 5, the marks are, on average, 5 marks away from the mean. It is in the same units as the data, and a larger value means more scattered data.
Why absolute values?
The deviations xi − x̄ from the mean always add up to 0, because the values above the mean balance those below it. Their plain average is therefore 0 for every data set and says nothing about spread. Dropping the signs keeps only the sizes of the deviations:
Recall, that the absolute value of the difference of two numbers gives the distance between the numbers when represented on a number line.
NCERT Mathematics (Class 11), Section 13.4, page 260
So |xi − a|, the modulus of the deviation, is the distance of xi from a, and it is never negative, so the distances cannot cancel.
Mean deviation about a
M.D.(a) = (1/n) Σ|x − a|
Mean deviation may be obtained from any measure of central tendency.
NCERT Mathematics (Class 11), Section 13.4, page 260
In practice it is taken about the mean or the median. NCERT writes M for the median throughout the chapter.
Ungrouped data
For a list of n values, NCERT’s steps (page 260) are:
- Find the central value a (the mean or the median).
- Find each deviation xi − a.
- Drop the minus signs to get |xi − a|.
- Add these distances and divide by n.
NCERT Example 1 (page 261). For 6, 7, 10, 12, 13, 4, 8, 12, the mean is 72/8 = 9. The deviations are −3, −2, 1, 3, 4, −5, −1, 3 (they add up to 0), and their sizes 3, 2, 1, 3, 4, 5, 1, 3 add up to 22. So M.D.(x̄) = 22/8 = 2.75.
NCERT Example 2 (pages 261–262) works the same way for the 20 values 12, 3, 18, 17, 4, 9, 17, 19, 20, 15, 8, 17, 2, 3, 16, 11, 3, 1, 0, 5: the mean is 200/20 = 10, the distances from 10 add up to 124, and M.D.(x̄) = 124/20 = 6.2.
About the median, NCERT Example 3 (page 262). Sorted, the 11 values are 3, 3, 4, 5, 7, 9, 10, 12, 18, 19, 21, and the 6th value, 9, is the median. The distances from 9 are 6, 6, 5, 4, 2, 0, 1, 3, 9, 10, 12, which add up to 58, so M.D.(M) = 58/11 ≈ 5.27.
Discrete frequency distribution
When the value xi occurs fi times, its distance is counted fi times. With N = Σfi observations in all:
Mean deviation for a frequency table
x̄ = (1/N) Σfx
M.D.(x̄) = (1/N) Σf|x − x̄|
M.D.(M) = (1/N) Σf|x − M|
NCERT Example 4 (pages 263–264). For xi = 2, 5, 6, 8, 10, 12 with frequencies 2, 8, 10, 7, 8, 5, N = 40 and Σfixi = 4 + 40 + 60 + 56 + 80 + 60 = 300, so x̄ = 300/40 = 7.5.
| xi | fi | distance from 7.5 | fi × distance |
|---|---|---|---|
| 2 | 2 | 5.5 | 11 |
| 5 | 8 | 2.5 | 20 |
| 6 | 10 | 1.5 | 15 |
| 8 | 7 | 0.5 | 3.5 |
| 10 | 8 | 2.5 | 20 |
| 12 | 5 | 4.5 | 22.5 |
The last column adds up to 92, so M.D.(x̄) = 92/40 = 2.3.
The median of a frequency table. Arrange the values in order and write the cumulative frequencies. NCERT (page 263) takes as the median the value whose cumulative frequency is equal to or just greater than N/2. That rule needs one correction: when N is even and some cumulative frequency is exactly N/2, the two middle observations are different values, and the median is the mean of that value and the next one. (For the values 2, 4, 6 with frequencies 3, 2, 5, N = 10 and the cumulative frequency of 4 is exactly 5, so the rule gives 4; but the 5th and 6th observations are 4 and 6, so the median is 5.)
NCERT Example 5 (pages 264–265). For xi = 3, 6, 9, 12, 13, 15, 21, 22 with frequencies 3, 4, 5, 2, 4, 5, 4, 3, the cumulative frequencies are 3, 7, 12, 14, 18, 23, 27, 30. N = 30, and the 15th and 16th observations are both 13, so M = 13. The distances from 13, times the frequencies, are 30, 28, 20, 2, 0, 10, 32, 27, which add up to 149, so M.D.(M) = 149/30 ≈ 4.97.
Continuous frequency distribution
While calculating the mean of a continuous frequency distribution, we had made the assumption that the frequency in each class is centred at its mid-point.
NCERT Mathematics (Class 11), Section 13.4.2, page 265
This is a grouped-data approximation: individual observations are unknown. Each class is replaced by its mid-point xi, and the table is then treated exactly like a discrete one.
NCERT Example 6 (page 266). Marks 10–20, 20–30, …, 70–80 for 2, 3, 8, 14, 8, 3, 2 students. The mid-points are 15, 25, …, 75, N = 40 and Σfixi = 1800, so x̄ = 45. The mid-points lie 30, 20, 10, 0, 10, 20, 30 from 45.
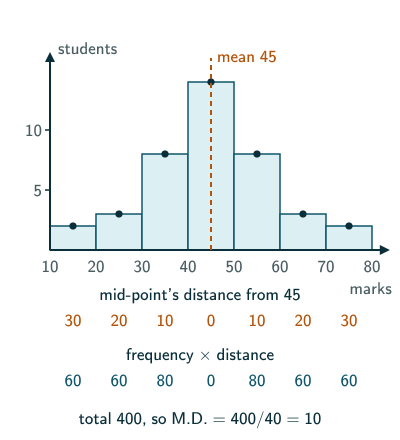
Step deviations. To shorten the arithmetic, NCERT (pages 266–267) takes an assumed mean A near the middle and a positive common factor h, and works with di = (xi − A)/h. (NCERT calls the assumed mean a; it is written A here so that it is not confused with the a in M.D.(a).) Then
Mean by step deviations
x̄ = A + h × (Σfd)/N
In NCERT Example 6, A = 45 and h = 10 give di = −3, −2, −1, 0, 1, 2, 3 and Σfidi = 0, so x̄ = 45 again. Shifting the origin does not change any distance, and dividing by h divides every distance by h. So you can also find the mean deviation of the di about their own mean d̄ and multiply it by h, where d̄ = (x̄ − A)/h. Here d̄ = 0 because A = 45 is the mean, so the distances are just |di|: (6 + 6 + 8 + 0 + 8 + 6 + 6)/40 = 1, and 1 × 10 = 10. NCERT itself uses step deviations only to find x̄ (page 268).
About the median. Find the median class (the first class whose cumulative frequency is at least N/2), then the median, where l is the lower boundary of the median class, f its frequency, h its width and C the cumulative frequency of the class before it:
Median of grouped data
M = l + ((N/2 − C)/f) × h
NCERT Example 7 (pages 269–270). For classes 0–10, …, 50–60 with frequencies 6, 7, 15, 16, 4, 2, N = 50 and the cumulative frequencies are 6, 13, 28, 44, 48, 50. The 25th observation lies in 20–30, so M = 20 + ((25 − 13)/15) × 10 = 28. The mid-points 5, 15, …, 55 lie 23, 13, 3, 7, 17, 27 from 28; times the frequencies these give 138, 91, 45, 112, 68, 54, a total of 508. So M.D.(M) = 508/50 = 10.16.
If the classes have gaps, such as 16–20, 21–25, …, first make them continuous (15.5–20.5, 20.5–25.5, …), as the hint to NCERT Exercise 13.1, Q12 says.
The sum of distances is least about the median (JEE)
For any data, Σ|xi − a| is smallest when a is the median. To see why, sort the values and pair the smallest with the largest, the second smallest with the second largest, and so on. For one pair x1 ≤ xn, |x1 − a| + |xn − a| is at least xn − x1, and equals it exactly when a lies between them. The pairs sit inside one another, and the median lies inside every pair, so there every pair adds its least possible amount. When n is odd, the middle value is left unpaired, and its distance is 0 only at the median itself. When n is even, every a from the lower middle value to the upper one gives the same least sum.
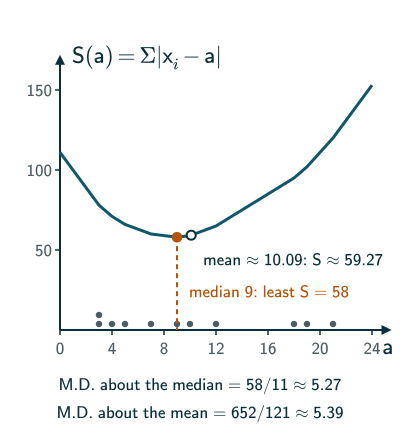
So M.D.(M) ≤ M.D.(x̄) when both centres and distances refer to the same observations (including a consistent weighted discrete representation). For NCERT Example 3’s data the mean is 111/11 ≈ 10.09 and the sum of distances from it is 652/11 ≈ 59.27, more than 58. But the two can be equal. NCERT (Section 13.4.3, page 271) says the sum of the distances from the mean is more than the sum from the median; that is not quite right, since it is never less but can be equal. In NCERT’s own Example 1, the mean and the median are both 9, and both sums are 22.
Shifting and scaling (JEE). If every value x becomes kx + c, the mean becomes kx̄ + c, the median becomes kM + c, and every distance is multiplied by |k|. So both mean deviations are multiplied by |k|, and adding c changes nothing.
Grouped-data caution. NCERT estimates a grouped median by interpolation but then measures distances from class mid-points. That interpolated median need not be the median of the midpoint data, so the inequality above need not hold for this mixture of approximations. For Example 7, the midpoint mean is 27.2, the midpoint median is 25, and the interpolated median is 28; the corresponding mean absolute distances are 10.064, 9.8 and 10.16. This does not contradict the theorem.
Limitations of the mean deviation
In a series, where the degree of variability is very high, the median is not a representative central tendency.
NCERT Mathematics (Class 11), Section 13.4.3, page 271
This is NCERT’s stated caution, not a general mathematical rule: a large spread alone does not make the median invalid. It remains a useful, outlier-resistant centre, particularly for skewed data. NCERT’s second point (page 271) builds on the comparison in the previous section: since the sum of distances about the mean is never less than about the median, it calls the mean deviation about the mean “not very scientific”.
Also mean deviation is calculated on the basis of absolute values of the deviations and therefore, cannot be subjected to further algebraic treatment.
NCERT Mathematics (Class 11), Section 13.4.3, page 271
The quoted phrase “cannot be subjected to further algebraic treatment” is too strong: the median-minimisation proof above is one such treatment. The practical distinction is that the modulus has a corner at 0, so formulas with |xi − a| do not combine or simplify easily; for example, there is no simple rule for the mean deviation of two groups put together. Squaring the deviations instead avoids this, which leads to the variance and the standard deviation in NCERT Section 13.5.
Solved examples
Example 1: About the mean (NCERT Exercise 13.1, Q1 data)
Find the mean deviation about the mean of 4, 7, 8, 9, 10, 12, 13, 17.
The mean is 80/8 = 10. The distances from 10 are 6, 3, 2, 1, 0, 2, 3, 7, which add up to 24.
Answer: M.D.(x̄) = 24/8 = 3.
Example 2: About the median (NCERT Exercise 13.1, Q3 data)
Find the mean deviation about the median of 13, 17, 16, 14, 11, 13, 10, 16, 11, 18, 12, 17.
Sorted: 10, 11, 11, 12, 13, 13, 14, 16, 16, 17, 17, 18. With 12 values, the median is the mean of the 6th and 7th, (13 + 14)/2 = 13.5. The distances from 13.5 are 3.5, 2.5, 2.5, 1.5, 0.5, 0.5, 0.5, 2.5, 2.5, 3.5, 3.5, 4.5, which add up to 28.
Answer: M.D.(M) = 28/12 = 7/3 ≈ 2.33.
Example 3: A frequency table about the mean (NCERT Exercise 13.1, Q5 data)
Find M.D.(x̄) for xi = 5, 10, 15, 20, 25 with frequencies 7, 4, 6, 3, 5.
N = 25 and Σfixi = 35 + 40 + 90 + 60 + 125 = 350, so x̄ = 14. The distances 9, 4, 1, 6, 11 times the frequencies give 63, 16, 6, 18, 55, a total of 158.
Answer: M.D.(x̄) = 158/25 = 6.32.
Example 4: A frequency table about the median (NCERT Exercise 13.1, Q7 data)
Find M.D.(M) for xi = 5, 7, 9, 10, 12, 15 with frequencies 8, 6, 2, 2, 2, 6.
N = 26 and the cumulative frequencies start 8, 14, so the 13th and 14th observations are both 7: M = 7. The distances 2, 0, 2, 3, 5, 8 times the frequencies give 16, 0, 4, 6, 10, 48, a total of 84.
Answer: M.D.(M) = 84/26 = 42/13 ≈ 3.23.
Example 5: Grouped data about the median (NCERT Exercise 13.1, Q11 data)
Marks 0–10, 10–20, …, 50–60 for 6, 8, 14, 16, 4, 2 girls. Find the mean deviation about the median.
N = 50 and the cumulative frequencies are 6, 14, 28, …, so the median class is 20–30 with C = 14 and f = 14:
M = 20 + ((25 − 14)/14) × 10
= 195/7 ≈ 27.86.
From 195/7, the mid-points 5, 15, …, 55 lie 160/7, 90/7, 20/7, 50/7, 120/7, 190/7 away. Times the frequencies 6, 8, 14, 16, 4, 2, these give 960/7, 720/7, 280/7, 800/7, 480/7 and 380/7, a total of 3620/7.
Answer: M.D.(M) = (3620/7)/50 = 362/35 ≈ 10.34.
Example 6: Changing the data
The mean deviation about the mean of a data set is 4. Find it when every value x is replaced by 2x + 3.
The mean also becomes 2x̄ + 3, so every distance doubles and the 3 has no effect.
Answer: 2 × 4 = 8.
Example 7: Median or mean?
For 1, 3, 8, 10, 13, compare the sums of the distances from the median and from the mean.
The median is 8: 7 + 5 + 0 + 2 + 5 = 19. The mean is 35/5 = 7: 6 + 4 + 1 + 3 + 6 = 20.
Answer: 19 < 20, as the median always gives the smallest sum.
Common mistakes to avoid
Common mistake
Keeping the signs
Without the modulus, the deviations from the mean add up to 0 for every data set. Use their sizes.
Common mistake
Dividing by the number of distinct values
In a frequency table, divide by N = Σfi, the number of observations, not by the number of different values.
Common mistake
Forgetting the frequencies
Each distance |xi − a| must be multiplied by its frequency fi before adding.
Common mistake
Using class limits instead of mid-points
For grouped data, measure the distance from each class mid-point, and make classes with gaps continuous before finding the median.
Common mistake
Taking the median from an unsorted list
Sort the data first. For an even number of values, the median is the mean of the two middle values.
Quick revision summary
- The mean deviation about a is the mean of the distances |xi − a|, usually about the mean or the median.
- For a list: M.D.(a) = (1/n) Σ|x − a|. For a frequency table: M.D.(a) = (1/N) Σf|x − a|, with N = Σfi.
- For grouped data, put each class at its mid-point; the median is l + ((N/2 − C)/f) × h.
- For the same observations or weighted discrete data, distances are least about their median: M.D.(M) ≤ M.D.(x̄), with equality possible. An interpolated grouped median is a different approximation.
- Replacing x by kx + c multiplies the mean deviation by |k|. The modulus makes the mean deviation hard to handle algebraically, which is why the standard deviation is used next.
Formula sheet
- M.D.(a) = (1/n) Σ|x − a|
- M.D.(a) = (1/N) Σf|x − a|, N = Σf
- x̄ = (1/N) Σfx
- x̄ = A + h × (Σfd)/N, d = (x − A)/h
- M = l + ((N/2 − C)/f) × h
- M.D.(M) ≤ M.D.(x̄), M the median of the same data
- x → kx + c: M.D. × |k|
Questions students ask
Is mean deviation the same as average deviation or mean absolute deviation?
Yes, mean deviation, average deviation and mean absolute deviation are names for one measure: the mean of the distances |xi − a| of the observations from a central value a, which NCERT writes M.D.(a). Books that say mean absolute deviation usually take it about the mean, M.D.(x̄), while NCERT also takes it about the median, M.D.(M). It is not the median absolute deviation (both are sometimes shortened to MAD), which is the median of the distances from the median, not their mean. In physics, the mean absolute error of repeated readings is the same calculation, about the mean of the readings.
What is the difference between mean and mean deviation?
The mean is a measure of central tendency, the average of the values, while the mean deviation is a measure of dispersion, the average distance of the values from a central value such as the mean. So the mean says where the data sit and the mean deviation how far they typically stray from it: the marks 48, 50, 52 and 20, 50, 80 both have mean 50, but mean deviations about the mean of 4/3 ≈ 1.33 and 20 marks. That is why an average is not enough to describe a data set.
What is the coefficient of mean deviation, and does mean deviation have units?
The coefficient of mean deviation is the mean deviation divided by the central value it was taken about, M.D.(x̄)/x̄ or M.D.(M)/M, a pure number with no units, while the mean deviation itself has the same units as the data: marks give marks and centimetres give centimetres. The coefficient compares data in different units or of very different sizes; it is beyond NCERT and meant for data with a positive centre and a meaningful zero on the measurement scale. For example, a mean deviation of ₹40 about a mean daily wage of ₹800 gives 0.05, and 2 marks about a mean of 25 marks gives 0.08, so relative to their size the marks vary more.
How do you find the mean deviation about the mode?
The mean deviation about the mode uses the same formula with the mode as the central value: the mean of the distances |xi − mode|, each counted fi times in a frequency table. NCERT notes that a mean deviation may be found about any measure of central tendency, though its examples use only the mean and the median. For 1, 1, 4, 6, 8 the mode is 1, the distances 0, 0, 3, 5, 7 add up to 15, and the mean deviation about the mode is 15/5 = 3, more than the 2.4 about the median 4, since no central value gives a smaller sum than the median. For grouped data, find the mode first with the grouped-data formula.
Practice questions
Try each question first, then open the answer to check your working.
-
Q1. Find the mean deviation about the mean of 38, 70, 48, 40, 42, 55, 63, 46, 54, 44 (NCERT Exercise 13.1, Q2 data).
Show answerHide answer
The mean is 500/10 = 50. The distances 12, 20, 2, 10, 8, 5, 13, 4, 4, 6 add up to 84, so M.D.(x̄) = 8.4.
-
Q2. Find the mean deviation about the median of 36, 72, 46, 42, 60, 45, 53, 46, 51, 49 (NCERT Exercise 13.1, Q4 data).
Show answerHide answer
Sorted: 36, 42, 45, 46, 46, 49, 51, 53, 60, 72, so M = (46 + 49)/2 = 47.5. The distances 11.5, 5.5, 2.5, 1.5, 1.5, 1.5, 3.5, 5.5, 12.5, 24.5 add up to 70, so M.D.(M) = 7.
-
Q3. Find M.D.(x̄) for xi = 10, 30, 50, 70, 90 with frequencies 4, 24, 28, 16, 8 (NCERT Exercise 13.1, Q6 data).
Show answerHide answer
N = 80 and Σfixi = 4000, so x̄ = 50. The distances 40, 20, 0, 20, 40 times the frequencies give 160, 480, 0, 320, 320, a total of 1280, so M.D.(x̄) = 1280/80 = 16.
-
Q4. For 1, 2, 3, 10, show that the sum of the distances from the median is less than the sum from the mean.
Show answerHide answer
The median is 2.5, with sum 1.5 + 0.5 + 0.5 + 7.5 = 10. The mean is 4, with sum 3 + 2 + 1 + 6 = 12. So 10 < 12.