Mode of ungrouped and grouped data
Beyond NCERT In the JEE Main syllabus; the Class 11 book has no section for it.
Quick answer
The mode is the value that occurs most often; a data set may have one mode, several or none. For grouped data with equal class widths, find the modal class (largest frequency) and use Mode = l + ((f − f)/(2f − f − f)) × h, where l is the lower boundary of the modal class, h the class width, f its frequency, and f and f the frequencies of the classes before and after it.
What is the mode?
Mode
- The mode of a set of observations is the value that occurs most often.
- A set can have one mode, two (bimodal) or more, or, by the convention used here, none when two or more distinct values all occur equally often. If every observation has the same value, that value is the mode.
- For grouped data, the modal class, for equal-width classes, is the class with the largest frequency, and the mode is estimated inside it.
JEE Main 2027 lists the “calculation of mean, median, mode of grouped and ungrouped data” in Unit 13, Statistics and Probability. The 2026–27 NCERT Class 11 chapter names the mode on page 257 as one of the three measures of central tendency, but of these three it computes only the mean and the median, so this page covers the mode.
In plain words, the mode is the most popular value: the commonest shoe size in a shop, or the commonest score in a test. Unlike the mean, it is not pulled by a few extreme values, and it also works for data that are not numbers at all, such as favourite colours.
Mode of ungrouped data
For a list, count how often each value occurs. For 2, 3, 3, 4, 4, 4, 5, 5, 6, 9, 12, the value 4 occurs three times and no other value as often, so the mode is 4. For a discrete frequency table, the mode is the value with the largest frequency.
Mode of grouped data
When the data are grouped into classes of equal width h, first find the modal class. The formula below estimates a mode by histogram interpolation; it cannot recover the exact mode of the unknown original observations. Its denominator must be non-zero. Let l be its lower class boundary, f1 its frequency, f0 the frequency of the class before it and f2 that of the class after it. Then
Mode of grouped data
Mode = l + t × h, where
t = (f − f)/(2f − f − f)
If the modal class is the first class, take f0 = 0; if it is the last, take f2 = 0. (There is no bar there, so its height is 0.) If the classes are written with gaps, such as 16–20, 21–25, …, first make them continuous, 15.5–20.5, 20.5–25.5, …: then l is a boundary such as 35.5 and h = 5, as in More practice Q8 below.
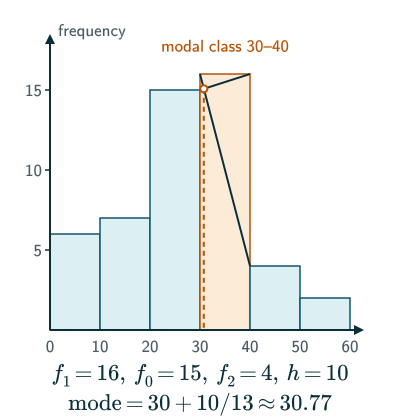
Where the formula comes from. In the histogram, join the top-left corner of the modal bar to the top-left corner of the next bar, and the top-right corner of the modal bar to the top-right corner of the bar before it. At a fraction t of the way across the modal class, the first line, falling from f1 to f2, is at height f1 + (f2 − f1)t, and the second, rising from f0 to f1, is at height f0 + (f1 − f0)t. The two lines cross where these are equal, that is where f1 − f0 = t(2f1 − f0 − f2). Solving gives t = (f1 − f0)/(2f1 − f0 − f2), and the mode is l + th. The mode leans towards the neighbour with the larger frequency.
Mean, median and mode together (JEE). For a symmetric distribution with a single peak and a finite mean, mean = median = mode. Symmetry alone is insufficient: 1, 1, 3, 5, 5 has mean and median 3 but modes 1 and 5. For data that are moderately skewed (lopsided), the three are roughly related by the empirical rule mode ≈ 3 median − 2 mean. It is a rule of thumb, not an identity: for the data above, the mean is 27.2 and the median 28, so the rule gives 29.6, while the formula gives 30.77. If every value x becomes ax + b with a ≠ 0, each mode becomes a × mode + b, If a = 0, all observations become b, whose mode is b. The non-zero transformation works like the mean and the median.
Solved examples
Example 1: Two modes
Find the mode of 1, 2, 2, 3, 4, 4, 5.
The values 2 and 4 each occur twice, and every other value once.
Answer: the data are bimodal, with modes 2 and 4.
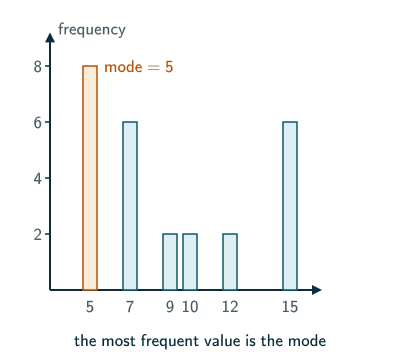
Example 2: A discrete frequency table (NCERT Exercise 13.1, Q7 data, page 270)
Find the mode of: xi = 5, 7, 9, 10, 12, 15 with frequencies 8, 6, 2, 2, 2, 6.
The largest frequency is 8, at x = 5.
Answer: the mode is 5.
Example 3: Grouped data (NCERT Example 7 data, page 269)
Classes 0–10, 10–20, 20–30, 30–40, 40–50, 50–60 have frequencies 6, 7, 15, 16, 4, 2. Find the mode.
The modal class is 30–40: l = 30, f1 = 16, f0 = 15, f2 = 4, h = 10.
Mode = 30 + (16 − 15)/(32 − 15 − 4) × 10
= 30 + 10/13.
Answer: about 30.77.
Example 4: Another grouped mode (NCERT Exercise 13.1, Q11 data, page 271)
Marks 0–10, 10–20, 20–30, 30–40, 40–50, 50–60 for 6, 8, 14, 16, 4, 2 girls. Find the mode.
The modal class is 30–40, with f1 = 16, f0 = 14, f2 = 4.
Mode = 30 + (16 − 14)/(32 − 14 − 4) × 10
= 30 + 20/14.
Answer: 30 + 10/7, about 31.43.
Example 5: The modal class comes first
Classes 0–10, 10–20, 20–30 have frequencies 12, 8, 5. Find the mode.
The modal class is 0–10, so f0 = 0, f1 = 12, f2 = 8.
Answer: 0 + (12 − 0)/(24 − 0 − 8) × 10 = 7.5.
Example 6: Using the empirical rule
A moderately lopsided distribution has mean 40 and median 42. Estimate its mode.
Answer: mode ≈ 3 × 42 − 2 × 40 = 46.
Common mistakes to avoid
Common mistake
Picking the largest value instead of the largest frequency
In Example 2 the largest value is 15, but the mode is 5, the value that occurs most often.
Common mistake
Using cumulative frequencies
The modal class is found from the frequencies themselves. The cumulative frequency is for the median.
Common mistake
Mixing up f and f
f0 belongs to the class before the modal class and f2 to the class after it. Swapping them moves the mode to the wrong side.
Common mistake
Treating the empirical rule as exact
Mode ≈ 3 median − 2 mean is only an estimate for moderately lopsided data. When the data are grouped, use the formula.
Quick revision summary
- The mode is the most frequent value; a data set can have one, several or no modes.
- For a discrete frequency table, the mode is the value with the largest frequency.
- For grouped data with equal class widths, the modal class has the largest frequency, and Mode = l + ((f1 − f0)/(2f1 − f0 − f2)) × h.
- For moderately lopsided data, mode ≈ 3 median − 2 mean, as a rough check.
Formula sheet
- Mode = l + ((f − f)/(2f − f − f)) × h
- f = 0 if the modal class is first; f = 0 if it is last
- mode ≈ 3 median − 2 mean (moderately lopsided data)
Questions students ask
Is the mode the same as the modal class?
No, the mode and the modal class are different: the modal class is the class interval with the largest frequency, while the mode is a single value estimated inside it by the grouped-data formula. For a modal class 40–50 of frequency 20, between classes of frequencies 12 and 8, the fraction is t = (20 − 12)/(40 − 12 − 8) = 0.4, so the mode is 40 + 0.4 × 10 = 44, not the whole interval 40–50. When the modal class has a larger frequency than both its neighbours, t lies strictly between 0 and 1, so the mode always falls inside the modal class.
What is the difference between the modal class and the median class?
The modal class is the class with the largest frequency, while the median class is the first class whose cumulative frequency reaches N/2, so the two come from different columns of the table and are often different classes. For classes 0–10, 10–20, 20–30, 30–40 with frequencies 4, 12, 9, 10, the modal class is 10–20, but N = 35 and the cumulative frequencies 4, 16, 25, 35 first reach 17.5 at 20–30, the median class. The mode is then estimated inside the modal class, and the median inside the median class by the median formula.
What are unimodal, bimodal and multimodal data?
Data are unimodal when one value occurs more often than any other, bimodal when two values share the largest frequency, trimodal when three do, and multimodal in general when there is more than one mode; if every value occurs equally often, the data have no mode under our convention when there are at least two distinct values; a constant data set has its constant value as its mode. For example, 3, 5, 5, 6, 8, 8, 9 is bimodal with modes 5 and 8, while 3, 5, 5, 6, 8, 8, 9, 9 is trimodal with modes 5, 8 and 9. In grouped data, two separate peaks in the histogram are often a sign that two different groups have been mixed together.
How do you find the mode of grouped data when two classes have the same highest frequency?
When two classes that are not next to each other share the largest frequency, the grouped data are bimodal: one common approach is to treat each as a modal class, apply the formula in each and report two modes. If exactly two highest classes are next to each other and the outer neighbours are lower, both interpolation calculations give their common boundary, because t = 1 in the first class and t = 0 in the second: for classes 0–10, 10–20, 20–30, 30–40 with frequencies 5, 14, 14, 6, the mode is 20. This is an interpolation convention, not proof that the unknown original observations peak exactly at that boundary. Three or more adjacent equal highest bars can give 0/0 in the formula: report the modal plateau instead of dividing by zero. Ties are beyond NCERT, and some books instead pick the modal class by the grouping method.
What are the merits and demerits of the mode?
The mode’s merits are that it is quick to find, is not pulled by extreme values and works even for non-numerical data, but it has clear demerits: it may not exist or may not be unique, and it ignores every value except the commonest. For grouped data it also depends on how the classes are drawn, so regrouping the same data into wider or shifted classes can move the mode noticeably. Unlike the mean, it cannot be combined across groups either: the modes of two sections of a class do not give the mode of the whole class.
Can the mode formula be used when the class widths are unequal?
The grouped-data mode formula cannot be used directly when the class widths are unequal, because it assumes that every class has the same width h. One common way is to divide each frequency by its class width to get the frequency density, the height of its histogram bar: the modal class is then the class with the largest density, and the densities of it and its two neighbours replace f1, f0 and f2, with h the width of the modal class. This is beyond NCERT: the Class 10 book gives the formula for equal class sizes and only remarks that unequal ones can be handled.
Practice questions
Try each question first, then open the answer to check your working.
-
Q1. Find the mode of 13, 17, 16, 14, 11, 13, 10, 16, 11, 18, 12, 17 (NCERT Exercise 13.1, Q3 data).
Show answerHide answer
11, 13, 16 and 17 each occur twice and the others once, so there are four modes: 11, 13, 16 and 17.
-
Q2. Find the mode of: xi = 15, 21, 27, 30, 35 with frequencies 3, 5, 6, 7, 8 (NCERT Exercise 13.1, Q8 data).
Show answerHide answer
The largest frequency, 8, is at 35, so the mode is 35.
-
Q3. Find the mode of the heights 95–105, 105–115, 115–125, 125–135, 135–145, 145–155 (cm) of 9, 13, 26, 30, 12, 10 boys (NCERT Exercise 13.1, Q10 data).
Show answerHide answer
The modal class is 125–135: 125 + (30 − 26)/(60 − 26 − 12) × 10 = 125 + 40/22 ≈ 126.82 cm.
-
Q4. Does 4, 4, 7, 7, 9, 9 have a mode?
Show answerHide answer
All three values occur equally often (twice each), so none occurs more often than the others: by the convention in the definition, the data have no mode.