Mean, median and mode
NCERT Class 11 Mathematics Chapter 13 Section 13.1
Quick answer
The mean, median and mode are measures of central tendency: the mean is Σx/n, the median is the middle value of the sorted data, and the mode is the most frequent value. The grouped-data median is estimated by M = l + ((N/2 − C)/f) × h, where l, f and h are the lower boundary, frequency and width of the median class, C is the cumulative frequency before it and N is the total frequency. Two data sets can share a mean and median but differ widely in spread, so measures of dispersion are needed too.
With your textbook
NCERT Mathematics (Class 11), Chapter 13 “Statistics”, Section 13.1 “Introduction”, pages 257–258.
Open the official NCERT chapter (PDF, 2.9 MB, ncert.nic.in) (opens in a new tab)
Checked against the 2026-27 reprint on .
Measures of central tendency
Measure of central tendency
We have also studied the methods of finding a representative value for the given data. This value is called the measure of central tendency.
NCERT Mathematics (Class 11), Section 13.1, page 257
Recall mean (arithmetic mean), median and mode are three measures of central tendency.
NCERT Mathematics (Class 11), Section 13.1, page 257
In plain words: one number that stands for the whole data set, telling roughly where the values are centred. The mean balances the data, the median sits in the middle of the sorted list, and the mode is the most frequent value. Chapter 13 recalls the mean and median from earlier classes and then moves on to how spread out the data are.
The mean
For n observations x1, x2, …, xn, the mean is their sum divided by n (NCERT pages 257–258). When the value xi occurs fi times, each value is counted with its frequency:
Mean
x̄ = (x + x + … + x)/n
x̄ = Σfx/N, where N = Σf
Two facts used all through the chapter.
- The deviations from the mean add up to 0: Σ(xi − x̄) = Σxi − nx̄ = 0, because Σxi = nx̄ (NCERT page 259).
- Adding a constant a to every value adds a to the mean; multiplying every value by k multiplies the mean by k. The median changes in the same way. For k ≠ 0, each mode also transforms this way, including when k is negative; when k = 0, every value becomes 0, whose mode is 0. These are what make the step-deviation shortcut of the later sections work.
For example, the first n natural numbers have mean (n + 1)/2, because their sum is n(n + 1)/2, the sum of an arithmetic progression.
The median
Also, the median is obtained by first arranging the data in ascending or descending order and applying the following rule.
NCERT Mathematics (Class 11), Section 13.1, page 258
The rule: if n is odd, the median is the ((n + 1)/2)th observation; if n is even, it is the mean of the (n/2)th and (n/2 + 1)th observations (NCERT page 258).
Grouped data (recalled in NCERT Section 13.4.2, page 269). Find the median class, the first class whose cumulative frequency is at least N/2. Then
Median of a continuous frequency distribution
M = l + ((N/2 − C)/f) × h
This is an estimate obtained by assuming observations are spread uniformly within the median class. Here l is the lower class boundary, f the frequency and h the width of the median class, C the cumulative frequency of the class before it, and N = Σfi.
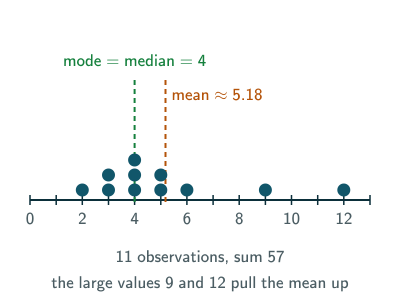
The mode is the value that occurs most often. In a frequency table it is the value with the largest frequency: for the data of Example 2 below it is 6 (frequency 10). A data set can have several modes (13, 17, 16, 14, 11, 13, 10, 16, 11, 18, 12, 17 has four: 11, 13, 16 and 17) or none (4, 7, 8, 9, 10, 12, 13, 17). For grouped data it comes from the modal class, the class with the largest frequency for equal-width classes, through a formula. Extreme magnitudes can pull the mean strongly. The median is less sensitive, and the mode depends on frequencies rather than magnitudes, though replacing observations can still change either.
Why an average is not enough
NCERT compares two batsmen over ten matches (page 257):
- A: 30, 91, 0, 64, 42, 80, 30, 5, 117, 71
- B: 53, 46, 48, 50, 53, 53, 58, 60, 57, 52
Both have mean 53 and median 53, yet A’s scores run from 0 to 117 and B’s from 46 to 60.
Thus, the measures of central tendency are not sufficient to give complete information about a given data.
NCERT Mathematics (Class 11), Section 13.1, page 258
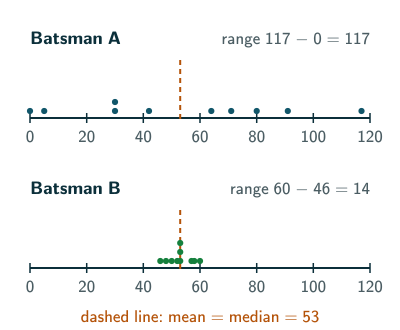
The extra number we need, one that measures how scattered the data are, is a measure of dispersion. The rest of the chapter builds them: the range, the mean deviation and the standard deviation.
Solved examples
Example 1: The batsmen’s means and medians (NCERT page 257)
Check that both batsmen have mean 53 and median 53.
A’s runs add up to 530, and so do B’s, so each mean is 530/10 = 53. Sorted, A’s runs are 0, 5, 30, 30, 42, 64, 71, 80, 91, 117; the 5th and 6th are 42 and 64. B’s sorted runs are 46, 48, 50, 52, 53, 53, 53, 57, 58, 60; the 5th and 6th are both 53.
Answer: A’s median is (42 + 64)/2 = 53 and B’s is 53. Their modes differ: A’s is 30 and B’s is 53.
Example 2: Mean of a frequency table
Find the mean of: xi = 2, 5, 6, 8, 10, 12 with frequencies 2, 8, 10, 7, 8, 5 (NCERT Example 4 data, page 263).
Σfi = 40 and Σfixi = 4 + 40 + 60 + 56 + 80 + 60 = 300.
Answer: x̄ = 300/40 = 7.5.
Example 3: Median of an odd and an even list
Find the median of 3, 9, 4, 12, 7 and of 3, 9, 4, 12, 7, 10.
Sorted: 3, 4, 7, 9, 12, so the 3rd value is 7. Sorted: 3, 4, 7, 9, 10, 12, so the median is the mean of the 3rd and 4th values.
Answer: 7, and (7 + 9)/2 = 8.
Example 4: Median of grouped data (NCERT Example 7 data, page 269)
Classes 0–10, 10–20, 20–30, 30–40, 40–50, 50–60 have frequencies 6, 7, 15, 16, 4, 2. Find the median.
N = 50, N/2 = 25. The cumulative frequencies are 6, 13, 28, 44, 48, 50, so the median class is 20–30, with l = 20, C = 13, f = 15, h = 10.
Answer: M = 20 + (25 − 13)/15 × 10 = 20 + 8 = 28.
Example 5: A missing value
The mean of 6, 9, x, 11 and 14 is 10. Find x.
The sum must be 5 × 10 = 50, and 6 + 9 + 11 + 14 = 40.
Answer: x = 10.
Example 6: Changing all the values
The mean of a data set is 20. Find the new mean if every value is (i) increased by 5, (ii) doubled, (iii) doubled and then decreased by 3.
Answer: (i) 25; (ii) 40; (iii) 2 × 20 − 3 = 37.
Common mistakes to avoid
Common mistake
Taking the middle value of an unsorted list
Sort first. The middle entry of 3, 9, 4, 12, 7 as written is 4, but the median is 7.
Common mistake
Dividing by the number of distinct values
For a frequency table, divide Σfixi by N = Σfi, not by the number of rows.
Common mistake
Choosing the median class by the largest frequency
The median class is fixed by the cumulative frequency reaching N/2. The class with the largest frequency is the modal class, a different idea.
Common mistake
Using class limits when the classes have gaps
For classes 16–20, 21–25, … first make them continuous, 15.5–20.5, 20.5–25.5, …, as the hint to NCERT Exercise 13.1, Q12 (page 271) says. Then l is a boundary such as 20.5, not 21.
Common mistake
Judging two data sets by their means alone
Batsmen A and B have the same mean and median but very different consistency. A measure of dispersion is needed as well.
Quick revision summary
- The mean, the median and the mode are measures of central tendency: one representative value for the data.
- Mean: x̄ = Σxi/n, or Σfixi/N for a frequency table; Σ(xi − x̄) = 0.
- Median: the middle value of the sorted data, or the mean of the two middle values; for grouped data, M = l + ((N/2 − C)/f) × h.
- Mode: the most frequent value; there can be several, or none.
- The same centre can hide very different spreads, so a measure of dispersion is also needed.
Formula sheet
- x̄ = Σfx/N, N = Σf
- Σ(x − x̄) = 0
- median: ((n + 1)/2)th value (n odd); mean of the (n/2)th and (n/2 + 1)th (n even)
- M = l + ((N/2 − C)/f) × h
Questions students ask
What is the difference between mean and median?
The mean and the median differ in what they use: the mean is the sum of all the observations divided by their number, while the median is the middle value once the data are sorted, so it depends only on the middle one or two values, not on how far out the others lie. One very large or very small value can drag the mean a long way but barely moves the median. For monthly incomes of ₹18, 20, 21, 23 and 118 thousand, the mean is ₹40 thousand but the median is ₹21 thousand, much closer to what a typical person in the group earns. For symmetric data the two are equal.
When should you use the mean, the median or the mode?
Use the mean for roughly symmetric data without extreme values, because it uses every observation and is the starting point for the variance and the standard deviation. Use the median when a few extreme values or a long tail would distort the mean, as with incomes or house prices, and when the end classes are open, such as “below 10” or “60 and above”, provided the median class itself has finite boundaries; the outer open classes then need no mid-points. Use the mode for the most common value, such as the T-shirt size a shop should stock most; it is the only one of the three that works for categories with no order, such as blood groups.
What is the relation between mean, median and mode?
For a symmetric distribution with a single peak, the mean, the median and the mode are equal; for moderately skewed (lopsided) data they are linked only roughly, by the empirical relation mode ≈ 3 median − 2 mean. This relation is a rule of thumb seen in real data, not an exact result, and it can fail badly for very skewed data or data with two peaks; the NCERT Class 11 book does not use it, though the NCERT Class 10 Statistics chapter quotes it as 3 Median = Mode + 2 Mean. For example, data with mean 35 and median 32 have a mode of about 3 × 32 − 2 × 35 = 26: a long tail of large values pulls the mean above the median, and the mode lies lowest.
What are the formulas for mean, median and mode of grouped data?
The midpoint estimate of the mean of grouped data is x̄ = Σfixi/N, where N = Σfi and each class is represented by its mid-point xi. The median is M = l + ((N/2 − C)/f) × h, where l, f and h are the lower boundary, frequency and width of the median class, the first class whose cumulative frequency reaches N/2, and C is the cumulative frequency before it. The mode is found inside the modal class, the class with the largest frequency, by the formula for the mode of grouped data.
Are mean, median and mode in Class 11 and the JEE Main syllabus?
Mean, median and mode are all in the JEE Main syllabus (Unit 13, Statistics and Probability), which lists the “calculation of mean, median, mode of grouped and ungrouped data”, but the NCERT Class 11 book only recalls them. Its 2026–27 edition recalls the mean and the median in Sections 13.1 and 13.4.2 before moving on to measures of dispersion, and it does not compute the mode at all. So JEE students revise the grouped-data formulas of the NCERT Class 10 Statistics chapter as well, including the mode of grouped data.
Do the mean, median and mode have units?
For numerical measurements, the mean, median and mode have the same unit as the data: the mean of heights measured in centimetres is in centimetres, and the median of runs scored is in runs. They are values on the same scale as the observations, so each can be marked on the same number line as the data and compared with any single observation. A categorical mode, such as a blood group, is a category and has no measurement unit.
Practice questions
Try each question first, then open the answer to check your working.
-
Q1. Find the mean and the median of 4, 7, 8, 9, 10, 12, 13, 17 (NCERT Exercise 13.1, Q1 data).
Show answerHide answer
The sum is 80, so the mean is 10. The 4th and 5th values are 9 and 10, so the median is 9.5.
-
Q2. Find the mean and the median of 13, 17, 16, 14, 11, 13, 10, 16, 11, 18, 12, 17 (NCERT Exercise 13.1, Q3 data).
Show answerHide answer
The sum is 168, so the mean is 14. Sorted, the 6th and 7th values are 13 and 14, so the median is 13.5.
-
Q3. The mean of five numbers is 18. One number is removed and the mean of the rest is 16. Which number was removed?
Show answerHide answer
The sum falls from 90 to 64, so the number removed is 26.
-
Q4. Show that the deviations of 2, 5, 11 from their mean add up to 0.
Show answerHide answer
The mean is 6, and the deviations −4, −1 and 5 add up to 0.