Stress-strain curve
NCERT Class 11 Physics Chapter 8 Section 8.4
Quick answer
A stress-strain curve shows how a material deforms as the load on it grows. For a metal it is straight up to the proportional limit (Hooke’s law), stays elastic up to the yield point or elastic limit, then deforms plastically (leaving a permanent set if unloaded), reaches its ultimate tensile strength and fractures. Brittle materials fracture with little plastic deformation, while ductile materials permit substantial plastic deformation; ultimate tensile load and fracture load can differ.
With your textbook
NCERT Physics Part II (Class 11), Chapter 8 “Mechanical Properties of Solids”, Section 8.4 “Stress-strain curve”, pages 169–170.
Open the official NCERT chapter (PDF, 1.2 MB, ncert.nic.in) (opens in a new tab)
Checked against the 2026-27 reprint on .
What is a stress-strain curve?
Stress-strain curve
A stress-strain curve is the graph of stress against strain for a material, found by stretching a test wire or cylinder in steps and recording the strain produced by each load (NCERT Section 8.4, page 169). Use engineering stress (load/original area) and engineering strain (extension/original length). The points in NCERT’s schematic metal curve are:
- A, proportional limit: up to here stress is proportional to strain (Hooke’s law);
- B, yield point (elastic limit): up to here the body still returns to its original size when unloaded; the stress at B is the yield strength σy;
- D, ultimate tensile strength σu: the maximum engineering tensile stress;
- E, fracture: the point where it breaks.
In plain words: pull a metal wire harder and harder and four things happen in turn. At first it stretches a little, in proportion to the pull, and springs back. Then it still springs back, but the stretch is no longer proportional. Past the yield point it starts to stretch a lot for little extra pull and no longer springs back fully. Finally it reaches the most it can carry and breaks. Each material has its own curve, which is why engineers measure it.
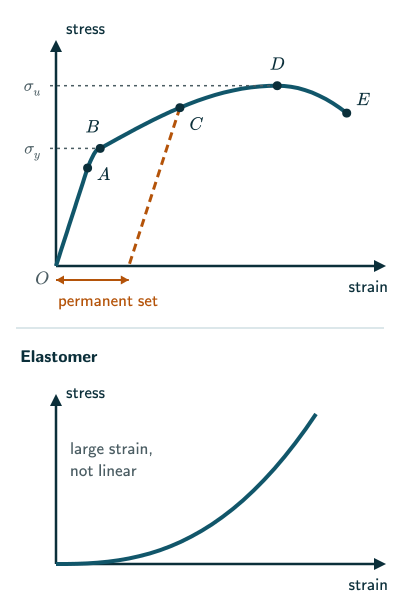
Reading the curve for a metal
O to A: Hooke’s law. The curve is a straight line: stress is proportional to strain, as Hooke’s law states. The body regains its original dimensions when the load is removed; it behaves as an elastic body (NCERT, page 169). The slope of OA is the Young’s modulus Y of the material (NCERT Section 8.5.1, page 170): a steeper OA means a stiffer material. On two curves drawn to the same scale, the one with the higher D is the stronger material.
A to B: elastic but not proportional. Stress and strain are no longer proportional, but the body still returns to its original dimensions when the load is removed. B is called the yield point, also known as the elastic limit, and the stress there is the yield strength σy. (In real metals A and B are very close, which is why NCERT Fig. 8.2 draws them almost touching. Keep them distinct all the same: Hooke’s law holds only up to A.)
B to D: plastic deformation. Beyond the yield strength, the strain grows rapidly even for a small increase in stress. If the load is removed at some point C between B and D, the body does not regain its original size:
In this case, even when the stress is zero, the strain is not zero. The material is said to have a permanent set.
NCERT Physics Part II (Class 11), Section 8.4, page 169
The deformation is then called plastic deformation. On unloading, the curve comes down along a line roughly parallel to OA (dashed in the figure), so only the elastic part of the strain is recovered. NCERT Fig. 8.2 draws this dashed line, but the text does not discuss it.
D: ultimate tensile strength. The point D on the graph is the ultimate tensile strength, σu, of the material (NCERT, page 169). Beyond the NCERT text: it is the highest engineering stress, maximum load divided by the original cross-sectional area, and in a ductile material the load at fracture E can be lower after necking, so ultimate load and fracture load are not generally the same (Wikipedia, “Ultimate tensile strength”).
D to E: towards fracture. Beyond D, additional strain is produced even by a reduced applied force, and the material fractures at E (NCERT, page 169). Beyond the NCERT text: in this stage a ductile specimen narrows locally (it “necks”); the engineering stress, calculated with the original cross-sectional area, falls, while the local stress in the neck, on the shrinking area, is the largest in the specimen (Wikipedia, “Ultimate tensile strength” and “Necking (engineering)”).
Brittle and ductile materials
If the ultimate strength and fracture points D and E are close, the material is said to be brittle. If they are far apart, the material is said to be ductile.
NCERT Physics Part II (Class 11), Section 8.4, page 169
In an exam, use NCERT’s definition. Beyond the NCERT text: the underlying difference is how much a material deforms plastically before it fractures: brittle materials break with little or none, while most metals deform plastically, and may neck, first (Wikipedia, “Ultimate tensile strength”).
- Brittle materials, such as glass and cast iron, break soon after their ultimate strength with little warning and little permanent stretch.
- Ductile materials, such as copper, aluminium and mild steel, stretch a great deal before breaking; they can be drawn into wires.
Elastomers
Some materials behave very differently. Rubber can be pulled to several times its original length and still return to its original shape. The elastic tissue of the aorta behaves similarly: its elastic region is very large, but it does not obey Hooke’s law over most of that region, and it has no well-defined plastic region (NCERT Section 8.4, page 170).
Substances like tissue of aorta, rubber etc. which can be stretched to cause large strains are called elastomers.
NCERT Physics Part II (Class 11), Section 8.4, page 170
In NCERT’s modulus terminology, steel is “more elastic”, meaning stiffer: it stretches far less for the same load, because its Young’s modulus is much larger (NCERT, Points to Ponder, page 177).
NCERT describes the aorta as “present in the heart” (page 170). The aorta is in fact the large artery that carries blood away from the heart, as NCERT’s own caption to Fig. 8.3 says.
Area under the curve. NCERT Section 8.5.5 (page 174) shows that in the straight region the work done per unit volume is ½ × stress × strain, the area of the triangle under OA. Beyond the NCERT text: just as the area under a force-extension graph is the work done by a variable force, the area under the whole stress-strain curve, up to any point, is the work done per original specimen volume in a quasistatic uniaxial test. In the plastic range this work is not all recoverable elastic energy. A tough material, one with a large area before fracture, absorbs a lot of energy before it breaks.
Solved examples
The data come from NCERT Table 8.1 (page 170). Take g = 9.8 m s.
Example 1: Yield load and ultimate load for a steel wire
A steel wire has a cross-section of 1.0 mm. NCERT Table 8.1 gives steel a yield strength of 250 × 10 N m and an ultimate strength of 400 × 10 N m. In NCERT’s ideal yield-point model, find the load at onset of yielding and the maximum tensile load. Can the fracture load be determined from these data?
Largest load without permanent set: σyA = 250 × 10 × 1.0 × 10 = 250 N, the weight of about 25.5 kg.
Maximum tensile load: σuA = 400 × 10 × 1.0 × 10 = 400 N, the weight of about 40.8 kg.
Answer: yield load 250 N; maximum tensile load 400 N. The fracture load requires the stress at E and is not determined by the ultimate strength alone.
Example 2: A copper wire
A copper wire has a diameter of 2.0 mm. Copper’s yield strength is 200 × 10 N m and its ultimate strength 400 × 10 N m (NCERT Table 8.1). Find the yield load and maximum tensile load in the same model.
A = π(1.0 × 10), about 3.14 × 10 m.
Without permanent set: 200 × 10 × 3.14 × 10, about 628 N (about 64 kg).
Maximum tensile load: 400 × 10 × 3.14 × 10, about 1260 N.
Answer: yield load about 628 N; maximum tensile load about 1260 N, not necessarily the load at fracture.
Example 3: How big is the permanent set?
A steel wire 2.0 m long is loaded to a point C where the stress is 300 × 10 N m and the strain 0.010, then unloaded. On unloading it follows a line parallel to OA, whose slope is steel’s Young’s modulus, 200 × 10 N m (NCERT Table 8.1). Find the permanent set.
The elastic strain recovered is 300 × 10/(2.0 × 10) = 1.5 × 10. The strain left is 0.010 − 0.0015 = 8.5 × 10, and on a 2.0 m wire that is 8.5 × 10 × 2.0 m = 0.017 m.
Answer: a permanent set of about 17 mm.
Example 4: How small the elastic region of a metal is
Up to what strain does steel stay elastic? Compare with rubber.
The strain at the yield point is roughly σy divided by the slope of OA: 250 × 10/(2.0 × 10) = 1.25 × 10, about 0.13%. Rubber, by contrast, can be stretched to several times its length, a strain of several hundred per cent, and still recover.
Answer: about 0.13% for steel, against several hundred per cent for rubber. That is why the curve in the figure is not drawn to scale.
Common mistakes to avoid
Common mistake
Thinking Hooke’s law holds up to the elastic limit
Hooke’s law holds only up to the proportional limit A. Between A and B the body is still elastic but stress is not proportional to strain.
Common mistake
Confusing yield strength with ultimate strength
The yield strength (at B) is where permanent deformation begins; the ultimate strength (at D) is the greatest engineering tensile stress. Safe designs keep stresses well below the yield strength.
Common mistake
Defining brittle and ductile by strength
Brittle and ductile describe how close the fracture point E is to the ultimate strength D (NCERT page 169), that is, how much a material deforms plastically before it breaks, not how strong it is (reasoned). Glass is brittle; copper is ductile.
Common mistake
Thinking an elastomer obeys Hooke’s law because it is elastic
Rubber and aorta tissue recover from very large strains, but their stress-strain graphs are curved: elastic does not mean linear.
Quick revision summary
- A stress-strain curve shows how a material deforms as the load grows; it varies from material to material.
- For a metal: OA is linear (Hooke’s law); B is the yield point or elastic limit, with stress σy, the yield strength; beyond B the deformation is plastic and leaves a permanent set.
- D is the ultimate tensile strength σu; the material fractures at E.
- D and E close together: brittle; far apart: ductile (NCERT). Brittle materials fracture with little plastic deformation, ductile ones after a lot.
- Elastomers such as rubber and aorta tissue stretch to large strains elastically, without obeying Hooke’s law and without a clear plastic region.
Formula sheet
- Largest load without permanent set = σy × A
- Maximum tensile load = σu × A (A = original area)
- Permanent strain ≈ strain at C − (stress at C)/(slope of OA)
Questions students ask
What is the difference between the proportional limit, the elastic limit and the yield point?
The proportional limit is where the straight part of a stress-strain curve ends, the elastic limit is the largest stress from which a material still returns fully to its original size, and the yield point is where it starts to deform plastically, stretching a lot for little extra stress. They come in that order as the load grows, but in most metals they lie so close together that NCERT treats the elastic limit and the yield point as one point, B, and many books state Hooke’s law “within the elastic limit”. For materials without a distinct yield point, a common convention is the 0.2% proof stress, corresponding to that specified permanent strain. It is not the exact zero-permanent-strain elastic limit; the worked examples use NCERT’s ideal identification of B.
Is a material with a larger Young’s modulus also stronger?
A larger Young’s modulus means a stiffer material, not a stronger one: Young’s modulus is the slope of the straight part of the stress-strain curve, while strength is the height of the curve, the yield strength at B or the ultimate tensile strength at D. In NCERT Table 8.1 steel is nearly twice as stiff as copper (Y = 200 × 10 against 110 × 10 N m), yet the two have the same ultimate strength, 400 × 10 N m. Glass, nearly as stiff as aluminium, breaks with almost no plastic stretch.
What is the difference between a stress-strain curve and a load-extension graph?
A stress-strain curve describes a material, while a load-extension graph describes one specimen: stress is the load divided by the original cross-section, and strain is the extension divided by the original length. Because both are divided by constants, the two graphs have the same shape, but a thicker or shorter wire of the same metal gives a steeper load-extension graph, while comparable specimens tested in the same direction, material state and conditions give similar stress-strain curves. Necking and fracture measures can also depend on specimen geometry. With load plotted against extension, the slope of the straight part is the wire’s spring constant, YA/L, and the area under it is the work done.
Does a wire’s maximum tensile load depend on length or thickness?
For uniform specimens with the same ultimate tensile strength, negligible self-weight and comparable test conditions, the maximum load is σuA, with A the original cross-section. Doubling the diameter makes this load four times as large; the elementary model has no length factor. This is the maximum load, not necessarily the load at final fracture after necking. For a vertically hanging wire, self-weight gives a top stress approximately ρgL: setting this equal to σu gives a rough ultimate-length estimate, about 5.2 km for the listed steel values. Avoiding permanent strain requires using the lower yield strength; defects, necking and changing dimensions limit the estimate.
Practice questions
Try each question first, then open the answer to check your working. The data are from NCERT Table 8.1 (page 170).
-
Q1. A wire is loaded beyond its yield point and then unloaded. Describe what you would observe.
Show answerHide answer
It does not return to its original length: it keeps a permanent set. Only the elastic part of the strain is recovered.
-
Q2. An aluminium wire has a cross-section of 2.0 mm. Aluminium’s yield strength is 95 × 10 N m (NCERT Table 8.1). What is the largest load it can carry without permanent deformation?
Show answerHide answer
σyA = 95 × 10 × 2.0 × 10 = 190 N.
-
Q3. For making thin wires, would you choose a brittle or a ductile material? Why?
Show answerHide answer
A ductile material (D and E far apart) can be deformed plastically a great deal without breaking, so it can be drawn into wire.