Biodiversity: levels, patterns and loss
NCERT Class 12 Biology Chapter 13 Section 13.1
Quick answer
Biodiversity, a term popularised by Edward Wilson, is the combined diversity at all levels of biological organisation, chiefly genetic, species and ecological diversity. Over 1.5 million species have been described (IUCN, 2004) of an estimated 7 million; India, with 2.4 per cent of the land and 8.1 per cent of the species, is one of 12 mega diversity countries. Diversity falls from the tropics to the poles and rises with area, log S = log C + Z log A, and is now lost 100 to 1000 times faster than before humans, mainly through habitat loss, over-exploitation, alien species and co-extinctions.
With your textbook
NCERT Biology (Class 12), Chapter 13 “Biodiversity and Conservation”, Section 13.1 “Biodiversity”, pages 216–223.
Open the official NCERT chapter (PDF, 2.3 MB, ncert.nic.in) (opens in a new tab)
Checked against the 2026-27 reprint on .
What is biodiversity?
Biodiversity
In our biosphere immense diversity (or heterogeneity) exists not only at the species level but at all levels of biological organisation ranging from macromolecules within cells to biomes.
NCERT Biology (Class 12), Section 13.1, page 216
Biodiversity is the term popularised by the sociobiologist Edward Wilson for this combined diversity at all the levels of biological organisation (NCERT pages 216–217).
In plain words: biodiversity is the variety of life at every scale, from the differences between the genes of one species, through the number of different species, to the variety of forests, deserts, reefs and wetlands they live in.
- The variety amazes even us: there are more than 20 000 species of ants, 300 000 species of beetles (three lakh, in NCERT’s Indian grouping), 28 000 species of fishes and nearly 20 000 species of orchids (NCERT Chapter 13, Introduction, page 216).
- Ecologists and evolutionary biologists ask why there are so many species, how this diversity came about, how it matters to the biosphere and how humans benefit from it (page 216).
- It took millions of years of evolution to accumulate this diversity, but we could lose it in less than two centuries if the present rates of species losses continue (page 217).
Genetic, species and ecological diversity
NCERT names the three most important levels of biodiversity (page 217):
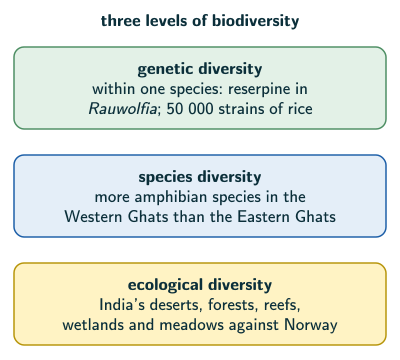
- Genetic diversity: a single species may show high diversity at the genetic level over its range. The medicinal plant Rauwolfia vomitoria, growing in different Himalayan ranges, may vary in the potency and concentration of its active chemical, reserpine. India has more than 50 000 genetically different strains of rice and 1000 varieties of mango.
- Species diversity: diversity at the species level; for example, the Western Ghats have a greater amphibian species diversity than the Eastern Ghats.
- Ecological diversity: diversity at the ecosystem level. India, with its deserts, rain forests, mangroves, coral reefs, wetlands, estuaries and alpine meadows, has a greater ecosystem diversity than a Scandinavian country like Norway.
NCERT slip (page 217): NCERT’s example of genetic diversity names Rauwolfia vomitoria “growing in different Himalayan ranges”. Beyond the NCERT text, the US Department of Agriculture’s plant taxonomy database, GRIN (public domain), lists this species (spelt Rauvolfia there) as native to tropical Africa, from West Africa east to Sudan and Tanzania and south to Angola; the reserpine-yielding species native to India, Nepal and Bhutan is Rauvolfia serpentina. In an exam, use NCERT’s example as printed: genetic diversity shown as differences in the potency and concentration of reserpine.
How many species are there?
- Published records tell us how many species have been recorded, but not how many exist (page 217).
- According to the IUCN (International Union for Conservation of Nature and Natural Resources) (2004), slightly more than 1.5 million plant and animal species have been described so far (page 217).
- Estimating the total: species inventories are more complete in temperate than in tropical countries, and most species still to be discovered are in the tropics. So biologists compare the temperate-to-tropical species richness of an exhaustively studied group of insects and extrapolate that ratio to other groups (page 217).
- Some extreme estimates range from 20 to 50 million; a more conservative and scientifically sound estimate by Robert May puts global species diversity at about 7 million (page 217).
- These estimates give no figures for prokaryotes: conventional taxonomic methods do not suit microbes, and many cannot be cultured; with biochemical or molecular criteria, their diversity alone might run into millions (page 218).
- NCERT’s Summary: more than 1.5 million species recorded, and nearly 6 million more might be waiting to be discovered and named (pages 225–226).
Reading note (page 217): the Class 11 book gives a different count, that known and described species number 1.7–1.8 million (NCERT Class 11 Biology, Chapter 1). Both are NCERT’s; for a Class 12 question on described species, use more than 1.5 million (IUCN, 2004).
What the recorded species are
- More than 70 per cent of all recorded species are animals; plants (including algae, fungi, bryophytes, gymnosperms and angiosperms) are no more than 22 per cent (page 218).
- Among animals, insects are the most species-rich group, more than 70 per cent of the total: out of every 10 animals, 7 are insects (page 218).
- The number of fungi species is more than the combined species of fishes, amphibians, reptiles and mammals (page 218). NCERT Figure 13.1 (page 218) draws three pie charts: among invertebrates, insects take by far the largest share; among vertebrates, fishes make up about half, the rest shared by birds, reptiles, amphibians and mammals; among ‘plants’, angiosperms and fungi are the two largest slices.
Reading note (page 218): here NCERT counts fungi among ‘plants’ in the old broad sense; in the five-kingdom system of NCERT Class 11 Biology, Chapter 2, fungi are a kingdom of their own (Kingdom Fungi). For this chapter’s species counts, keep NCERT’s grouping.
India: a mega diversity country
- India has only 2.4 per cent of the world’s land area but 8.1 per cent of its species diversity, which makes it one of the 12 mega diversity countries of the world (page 219).
- Nearly 45 000 species of plants and twice as many of animals have been recorded from India (page 219).
- If only 22 per cent of all species have been recorded, as May’s estimate implies, India probably has more than 100 000 plant species and more than 300 000 animal species still to be discovered and described (page 219). Our arithmetic agrees: 45 000 ÷ 0.22 ≈ 204 500 plant species in all, about 159 500 of them undiscovered; 90 000 ÷ 0.22 ≈ 409 100 animal species, about 319 100 undiscovered.
- Many of these may become extinct before we find them: “Nature’s biological library is burning even before we catalogued the titles of all the books stocked there” (page 219).
Patterns of biodiversity
Latitudinal gradients
- Species diversity generally decreases as we move away from the equator towards the poles. With very few exceptions, the tropics (23.5° N to 23.5° S) have more species than temperate or polar areas (page 219).
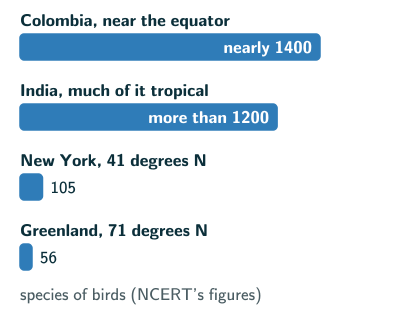
- Birds (page 219): Colombia, near the equator, has nearly 1400 species; New York (41° N) 105; Greenland (71° N) only 56. India, with much of its land in tropical latitudes, has more than 1200.
- A tropical forest in Ecuador has up to 10 times as many species of vascular plants as a forest of equal area in the Midwest of the USA (page 219).
- The Amazonian rain forest has the greatest biodiversity on earth: more than 40 000 species of plants, 3000 of fishes, 1300 of birds, 427 of mammals, 427 of amphibians, 378 of reptiles and more than 125 000 invertebrates; there might be at least two million insect species there still to be named (page 219).
Why are the tropics richer? NCERT gives three hypotheses (pages 219–220):
- Time: speciation is generally a function of time. Temperate regions suffered frequent glaciations, while tropical latitudes stayed relatively undisturbed for millions of years, giving a long evolutionary time for species diversification.
- Constancy: tropical environments are less seasonal, more constant and predictable; constant environments promote niche specialisation and greater species diversity.
- Energy: more solar energy is available in the tropics, which contributes to higher productivity and might, indirectly, to greater diversity.
NCERT slip (page 219): NCERT spells the country “Equador”; it is Ecuador. In an exam, write Ecuador.
Species–area relationships
- The German naturalist Alexander von Humboldt, exploring South American jungles, observed that within a region species richness increased with increasing explored area, but only up to a limit (page 220).
- For many taxa (angiosperm plants, birds, bats, freshwater fishes), NCERT says the relation between species richness and area turns out to be a rectangular hyperbola; on a logarithmic scale it is a straight line (NCERT Figure 13.2, page 220):
Species–area relationship (NCERT page 220)
- Here S is species richness, A the area, Z the slope of the line (regression coefficient) and C the Y-intercept (page 220; strictly, the straight line’s intercept on the log–log plot is log C, and C is the value of S when A = 1, our reasoning). Taking antilogs gives S = CAZ, the curve in NCERT Figure 13.2 (page 220).
- Ecologists find Z between 0.1 and 0.2, regardless of the taxonomic group or region: plants in Britain, birds in California and molluscs in New York state have amazingly similar slopes (page 220).
- Among very large areas such as entire continents, the slope is much steeper, with Z from 0.6 to 1.2; for frugivorous (fruit-eating) birds and mammals in tropical forests of different continents, it is 1.15 (page 220).
NCERT asks what steeper slopes mean (page 220). A steeper slope means species richness rises much faster with area. Each continent has its own long evolutionary history, so larger stretches of the earth bring in many species found nowhere else. With Z = 0.15, an area ten times larger holds 100.15 ≈ 1.4 times as many species; with Z = 1.15, about 101.15 ≈ 14 times as many (reasoned from NCERT’s equation, page 220; our arithmetic).
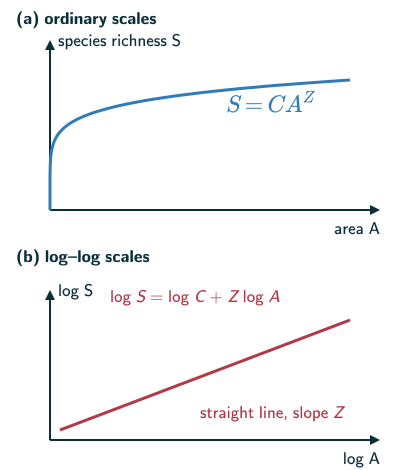
NCERT slip (page 220): NCERT calls the species–area curve a “rectangular hyperbola”, and its Summary repeats it (page 226). A rectangular hyperbola has asymptotes at right angles; a rising one, such as y = ax/(b + x), levels off towards a ceiling. NCERT’s own equation gives a different curve: S = CAZ, with Z between 0 and 1, is a power curve that keeps rising, ever more slowly, and only a power curve becomes a straight line on log–log axes, as NCERT Figure 13.2 shows (our reasoning from NCERT’s equation). In an exam, an option that says “rectangular hyperbola” is the one NCERT means; know the equation and its straight-line log form.
Importance of species diversity to the ecosystem
- Does the number of species matter to how an ecosystem works? Ecologists have no definitive answer; for decades they believed that communities with more species tend to be more stable (page 220).
- A stable community should not show too much variation in productivity from year to year; it must be resistant or resilient to occasional disturbances, natural or man-made; and it must resist invasions by alien species (page 221).
- David Tilman’s long-term experiments with outdoor plots found that plots with more species showed less year-to-year variation in total biomass, and that increased diversity contributed to higher productivity (page 221).
- Rich biodiversity is essential for ecosystem health and imperative for the survival of the human race (page 221).
Rivet popper hypothesis. Stanford ecologist Paul Ehrlich used an analogy (page 221):
- an airplane is the ecosystem, held together by thousands of rivets, the species;
- if every passenger pops a rivet to take home (a species becoming extinct), flight safety may not suffer at first, but as more rivets go, the plane becomes dangerously weak;
- which rivet is removed also matters: losing rivets on the wings (key species that drive major ecosystem functions) is more serious than losing a few on the seats or windows.
Loss of biodiversity
- It is doubtful whether any new species are being added through speciation, but losses continue, and human activities are clearly to blame (page 221).
- The colonisation of tropical Pacific Islands by humans is said to have led to the extinction of more than 2000 species of native birds (page 221).
- The IUCN Red List (2004) documents the extinction of 784 species in the last 500 years: 338 vertebrates, 359 invertebrates and 87 plants (page 221).
- Recent extinctions include the dodo (Mauritius), quagga (Africa), thylacine (Australia), Steller’s sea cow (Russia) and three subspecies of tiger (Bali, Javan, Caspian). The last twenty years alone saw 27 species disappear (page 221).
- Extinctions are not random across taxa: groups such as amphibians appear more vulnerable (page 222).
- More than 15 500 species worldwide face the threat of extinction. At present 12 per cent of all bird species, 23 per cent of mammal species, 32 per cent of amphibian species and 31 per cent of gymnosperm species face the threat of extinction (page 222).
Reading note (pages 221 and 226): the chapter Summary says “Nearly 700 species have become extinct in recent times” (page 226); the text’s IUCN figure is 784 species in the last 500 years (page 221). For a question on the IUCN Red List (2004), give 784 and its split, 338 + 359 + 87.
Mass extinctions and the sixth extinction
- Fossil records show five episodes of mass extinction in the more than 3 billion years since life originated and diversified (page 222).
- The ‘Sixth Extinction’ now in progress differs in its rate: current species extinction rates are estimated to be 100 to 1000 times faster than in pre-human times, and human activities are responsible (page 222).
- If present trends continue, nearly half of all species on earth might be wiped out within the next 100 years (page 222).
- In general, loss of biodiversity in a region may lead to (page 222):
- a decline in plant production;
- lowered resistance to environmental perturbations such as drought;
- increased variability in ecosystem processes such as plant productivity, water use, and pest and disease cycles.
Causes of loss: the evil quartet
The accelerated extinctions are largely due to human activities, through four major causes, nicknamed ‘The Evil Quartet’ (page 222):
- Habitat loss and fragmentation, the most important cause (pages 222–223):
- NCERT says tropical rain forests, once covering more than 14 per cent of the earth’s land surface, now cover no more than 6 per cent; its additional line, “By the time you finish reading this chapter, 1000 more hectares of rain forest would have been lost”, is rhetorical, not a time-defined current deforestation rate (our reading);
- the Amazon rain forest, so huge that it is called the ‘lungs of the planet’ (a metaphor, our reading), is being cleared for soya beans and for grasslands to raise beef cattle;
- pollution degrades many habitats;
- when large habitats are broken into small fragments, mammals and birds that need large territories, and migratory animals, are badly affected, and their populations decline.
- Over-exploitation: when ‘need’ turns to ‘greed’. Many extinctions of the last 500 years, such as Steller’s sea cow and the passenger pigeon, were due to over-exploitation; many marine fish populations are over-harvested today (page 223).
- Alien species invasions: introduced species, deliberately or not, may turn invasive and cause the decline or extinction of indigenous species, much as the prickly pear cactus ran wild in Australia without its natural predators (page 223; NCERT Chapter 11, page 197). Examples (page 223):
- the Nile perch in Lake Victoria (east Africa) eventually led to the extinction of more than 200 species of cichlid fish;
- invasive weeds: carrot grass (Parthenium), Lantana and water hyacinth (Eicchornia, as NCERT prints it);
- the illegal introduction of the African catfish Clarias gariepinus for aquaculture threatens our indigenous catfishes.
- Co-extinctions: when a species becomes extinct, the species associated with it in an obligatory way also go: a host fish’s unique parasites die with it, and in a coevolved plant-pollinator mutualism, the extinction of one invariably leads to the extinction of the other (page 223).
NCERT slip (page 223): water hyacinth’s genus is Eichhornia, not “Eicchornia”: the NCBI Taxonomy database (US National Library of Medicine, public domain) lists Eichhornia and finds no “Eicchornia”. In an exam, write Eichhornia.
Solved examples
Example 1: India’s share
India has 2.4 per cent of the world’s land area and 8.1 per cent of its species diversity. How many times its share of land is India’s share of species?
Answer: 8.1 ÷ 2.4 ≈ 3.4 times (our arithmetic from NCERT page 219).
Example 2: The IUCN extinction count
The IUCN Red List (2004) records 338 vertebrate, 359 invertebrate and 87 plant extinctions in the last 500 years. Check NCERT’s total, and find the share of invertebrates.
Answer: 338 + 359 + 87 = 784 species, as NCERT states; invertebrates are 359 ÷ 784 ≈ 0.46, about 46 per cent (our arithmetic from NCERT page 221).
Example 3: Using the species–area equation
On a log–log plot of species richness against area, the line rises by 0.3 in log S when log A rises by 2. What is Z, and does it fit a region within a continent?
Answer: Z = slope = 0.3 ÷ 2 = 0.15, inside NCERT’s range of 0.1 to 0.2 for areas within a region; across whole continents Z would be 0.6 to 1.2 (NCERT page 220).
Common mistakes to avoid
Common mistake
Thinking species diversity rises towards the poles
Species diversity generally decreases from the equator towards the poles; the tropics have the most species (NCERT page 219).
Common mistake
Quoting the steep slope for every species–area line
Within a region, Z lies between 0.1 and 0.2; only among very large areas such as whole continents is it 0.6 to 1.2 (NCERT page 220).
Common mistake
Naming over-exploitation as the most important cause of loss
Habitat loss and fragmentation is the most important cause; over-exploitation, alien species invasions and co-extinctions complete the evil quartet (NCERT pages 222–223).
Common mistake
Saying the sixth extinction differs in kind
Mass extinctions happened before humans; the present one differs in its rate, 100 to 1000 times faster, and in being caused by human activities (NCERT page 222).
Quick revision summary
- Biodiversity (Edward Wilson): diversity at all levels of organisation; the main levels are genetic (reserpine in one plant species; 50 000 rice strains, 1000 mangoes), species (Western Ghats amphibians) and ecological (India against Norway).
- More than 1.5 million species described (IUCN, 2004); Robert May’s estimate, about 7 million. Animals more than 70 per cent of recorded species, plants no more than 22; insects more than 70 per cent of animals; fungi more than all fishes, amphibians, reptiles and mammals.
- India: 2.4 per cent of land, 8.1 per cent of species; one of 12 mega diversity countries; about 45 000 plant and 90 000 animal species recorded.
- Patterns: diversity falls from the equator to the poles (time, constancy, energy); species richness rises with area, log S = log C + Z log A, with Z 0.1–0.2 within regions and 0.6–1.2 across continents.
- Tilman: plots with more species varied less in total biomass and were more productive; rivet popper hypothesis (Paul Ehrlich).
- Loss: 784 extinctions in 500 years (IUCN, 2004); more than 15 500 species threatened; sixth extinction 100–1000 times faster than before humans. Causes, the evil quartet: habitat loss and fragmentation, over-exploitation, alien species invasions, co-extinctions.
Formula sheet
- levels: genetic, species, ecological
- log S = log C + Z log A
- S = C AZ
- Z: 0.1–0.2 in a region; 0.6–1.2 continents
- India: 2.4% of land, 8.1% of species
- extinctions now 100–1000 times faster
Questions students ask
What is the difference between biodiversity and an ecosystem?
Biodiversity is the combined diversity at all the levels of biological organisation, from macromolecules within cells to biomes (NCERT pages 216–217), while NCERT’s ecosystem chapter calls an ecosystem “a functional unit of nature, where living organisms interact among themselves and also with the surrounding physical environment” (page 205). The two meet in ecological diversity, diversity at the ecosystem level, one of NCERT’s three most important levels (page 217). By our reading, an ecosystem is a unit of nature and biodiversity the variety within and among such units: one pond can be rich or poor in species.
Who coined the term biodiversity?
Beyond the NCERT text, the word biodiversity was introduced by Walter G. Rosen of the US National Research Council, who conceived the National Forum on BioDiversity held in Washington, D.C., in September 1986; Edward O. Wilson’s foreword to the forum’s book, Biodiversity (1988), credits Rosen with the term (National Academy Press, facts in our words). NCERT calls biodiversity the term “popularised by the sociobiologist Edward Wilson” (page 216), so for a question on who popularised it, Wilson is NCERT’s answer.
How do you calculate species richness from the species–area relationship?
To calculate species richness, put the values into NCERT’s equation log S = log C + Z log A (page 220), with logarithms to base 10, and take the antilog: with made-up values C = 20, Z = 0.1 and A = 10 000 km2, log S ≈ 1.30 + 0.1 × 4 = 1.70, so S ≈ 50 species (our arithmetic). To compare two areas of one region, C cancels: S2/S1 = (A2/A1)Z, so with Z = 0.1 an area 1000 times larger holds about 10000.1 ≈ 2 times as many species (our arithmetic).
Why are amphibians more vulnerable to extinction?
Beyond the NCERT text, amphibians are thought to be more vulnerable because their lives straddle water and land and their skin is permeable: a frog begins as a tadpole in water and moves onto land as an adult, so trouble in either habitat can harm it, and frog skin, which amphibians also breathe through, let three common herbicides through 26 to 302 times as readily as pig-ear skin in one study (Quaranta and others 2009, PLoS ONE, CC BY). A chytrid fungus disease has also killed amphibians in many regions, though habitat loss remains the main cause of their decline (Fisher 2009, PLoS Biology, CC BY). NCERT says only that amphibians “appear to be more vulnerable to extinction” (page 222).
Is there a formula for biodiversity?
NCERT Class 12 Biology gives no formula that measures biodiversity: the only equation in its Chapter 13, log S = log C + Z log A, links species richness to area (page 220). Beyond the NCERT text, ecologists measure diversity with indices such as Shannon’s diversity, H′ = −Σ pi ln pi, where pi is the proportion of individuals that belong to species i; such indices rise both with the number of species and with evenness, which is greatest when every species has about the same number of individuals (Morris and others 2014, Ecology and Evolution, CC BY). That study found no single index ideal for every purpose.
Is Biodiversity and Conservation deleted from the NEET (UG) 2026 syllabus?
No, Biodiversity and Conservation is not deleted from the NEET (UG) 2026 syllabus: Unit 10, Ecology and Environment, lists “Biodiversity and its conservation: Concept of Biodiversity; Patterns of Biodiversity; Importance of Biodiversity; Loss of Biodiversity; Biodiversity conservation; Hotspots, endangered organisms, extinction, Red Data Book”, then biosphere reserves, national parks, sanctuaries and sacred groves. By our reading, NCERT Chapter 13 teaches every item except the Red Data Book, which no NCERT Biology chapter names (Chapter 13 cites only the IUCN Red List, 2004); see Red Data Book and the IUCN Red List.
Practice questions
Try each question first, then open the answer to check your working.
-
Q1. Name the three important components of biodiversity. (NCERT Exercise 1, page 226.)
Show answerHide answer
Genetic diversity, species diversity and ecological (ecosystem) diversity (NCERT page 217).
-
Q2. How do ecologists estimate the total number of species present in the world? (NCERT Exercise 2, page 226.)
Show answerHide answer
Species inventories are more complete in temperate than in tropical countries, and most undiscovered species are in the tropics. So biologists make a statistical comparison of the temperate-tropical species richness of an exhaustively studied group of insects and extrapolate this ratio to other groups of animals and plants, to get a gross estimate of the total. Estimates range from extreme ones of 20 to 50 million to Robert May’s more conservative 7 million (NCERT page 217).
-
Q3. Give three hypotheses for explaining why tropics show greatest levels of species richness. (NCERT Exercise 3, page 227.)
Show answerHide answer
(a) Speciation is a function of time: tropical latitudes stayed relatively undisturbed for millions of years, unlike temperate regions with frequent glaciations, giving a long time for diversification. (b) Tropical environments are less seasonal, more constant and predictable, which promotes niche specialisation and greater diversity. (c) More solar energy is available in the tropics, giving higher productivity, which might indirectly contribute to greater diversity (NCERT pages 219–220).