Ecological pyramids
NCERT Class 12 Biology Chapter 12 Section 12.5
Quick answer
Ecological pyramids show number, biomass or energy at each trophic level, with the producers at the base and the top consumers at the apex. In most ecosystems all three are upright; the pyramid of numbers on a big tree and the pyramid of biomass in the sea can be inverted. The pyramid of energy is always upright, because some energy is lost as heat at each step.
With your textbook
NCERT Biology (Class 12), Chapter 12 “Ecosystem”, Section 12.5 “Ecological Pyramids”, pages 211–214.
Open the official NCERT chapter (PDF, 2.4 MB, ncert.nic.in) (opens in a new tab)
Checked against the 2026-27 reprint on .
What are ecological pyramids?
Ecological pyramids
When the food or energy relationship between organisms at different trophic levels is drawn level by level, in terms of number, biomass or energy, it takes the shape of a pyramid: broad at the base and narrowing towards the apex (NCERT pages 211–212).
The base of each pyramid represents the producers or the first trophic level while the apex represents tertiary or top level consumer.
NCERT Biology (Class 12), Section 12.5, page 212
In plain words: stack the trophic levels like floors of a building, with plants at the bottom, and make each floor as wide as the amount of life or energy on it. Because every level lives on the one below, and energy is lost at each step, the floors usually get narrower as you go up.
The three types usually studied are the pyramid of number, the pyramid of biomass and the pyramid of energy (page 212; NCERT Figure 12.4 (a)–(d), pages 212–213).
Pyramid of numbers
- It counts the individuals at each trophic level. In NCERT’s grassland (NCERT Figure 12.4 (a), page 212):
- producers (P): 5 842 000;
- primary consumers (PC): 708 000;
- secondary consumers (SC): 354 000;
- tertiary consumers (TC): 3.
- Only three top carnivores are supported by an ecosystem based on the production of nearly 6 million plants (NCERT Figure 12.4 (a) caption, page 212).
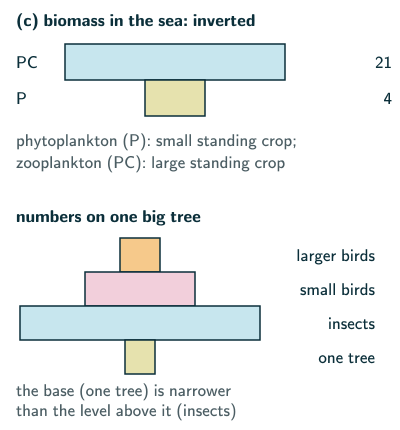
- Numbers can mislead, because one individual may be huge and another tiny. NCERT asks you to count the insects feeding on a big tree, then add the small birds that eat the insects and the larger birds that eat the small ones, and draw the shape (page 213). One tree at the base supports a great many insects, which support fewer small birds and still fewer larger birds: the base is narrower than the level above it, so the pyramid of numbers is inverted at the base (spindle-shaped if you include the birds) (reasoned from NCERT page 213). The same problem appears when you measure population density: one huge banyan tree counts as a single individual, so per cent cover or biomass is the more meaningful measure (NCERT Chapter 11, page 192).
Pyramid of biomass
- It shows the standing crop, the mass of living material, at each level at a particular time (NCERT page 211). In NCERT Figure 12.4 (b) (page 212), the dry weights are (NCERT labels them kg m; the source study used g m, see the slip below):
- P: 809;
- PC: 37;
- SC: 11;
- TC: 1.5.
- This example shows a sharp decrease in biomass at higher trophic levels (NCERT Figure 12.4 (b) caption, page 212).
- In the sea, the pyramid of biomass is generally inverted, because the biomass of fishes far exceeds that of phytoplankton (page 213). NCERT Figure 12.4 (c) (page 212) shows a small standing crop of phytoplankton (4) supporting a large standing crop of zooplankton (21). NCERT’s text names fishes and its figure zooplankton: both are consumers, and the point is that the consumers’ standing crop exceeds the phytoplankton’s. For a question on Figure 12.4 (c), answer zooplankton.
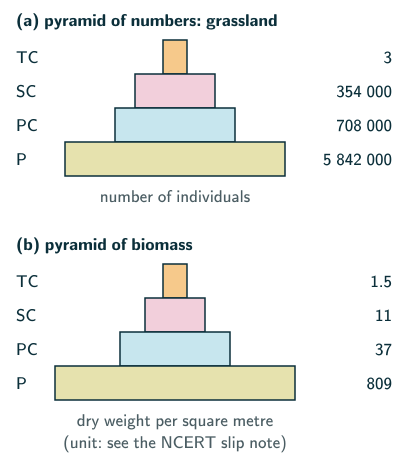
NCERT slip (page 212): NCERT labels the dry weights of Figure 12.4 (b) in kg m, a thousand times too large. These four values are those of a classic field study, H. T. Odum’s study of Silver Springs, Florida (Ecological Monographs, 1957), which reported them in grams of dry weight per square metre, g m (beyond the NCERT text; facts from the paper in our words). In an exam, use NCERT’s figure as printed, kg m included; the lesson is the sharp fall in biomass from level to level.
NCERT asks how the inverted pyramid of the sea can be explained, since it looks like a paradox (page 213). The pyramid of biomass shows the standing crop, the mass present at one moment (page 211). Phytoplankton can grow and turn over rapidly while grazing keeps their standing biomass small. Their production over time can support a larger consumer standing stock; comparing two stocks is different from comparing production rates. Measured as a rate, energy per year, the pyramid stays upright (reasoned from NCERT pages 207, 211 and 213).
Pyramid of energy
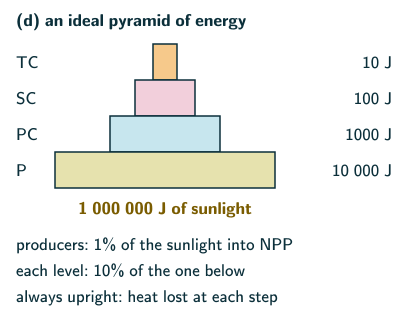
- NCERT’s ideal pyramid of energy (NCERT Figure 12.4 (d), page 213) starts from 1 000 000 J of sunlight:
- producers (P): 10 000 J;
- primary consumers (PC): 1000 J;
- secondary consumers (SC): 100 J;
- tertiary consumers (TC): 10 J.
- In this idealised example, primary producers convert 1 per cent of the energy in the sunlight available to them into NPP (10 000 of 1 000 000 J), and each level passes on 10 per cent to the next, as the 10 per cent law says (pages 211 and 213). This 1 per cent fits NCERT’s 2–10 per cent of PAR: PAR is under half the sunlight, and NPP leaves out what plants use in respiration (reasoned from NCERT pages 207 and 209).
- The pyramid of energy is always upright and can never be inverted, because when energy flows from one trophic level to the next, some energy is always lost as heat at each step (page 213).
- Each bar shows the amount of energy present at each trophic level in a given time or annually per unit area (page 213).
Upright and inverted pyramids
- In most ecosystems, all three pyramids are upright: producers are more in number and biomass than the herbivores, and herbivores more than the carnivores; and energy at a lower trophic level is always more than at a higher level (page 213).
- Exceptions (page 213):
- the pyramid of numbers for insects feeding on a big tree, with the birds above them, is inverted at the base;
- the pyramid of biomass in the sea is generally inverted.
- The pyramid of energy has no exception: it is never inverted (page 213).
A trophic level is a functional level
- Any calculation of energy content, biomass or numbers has to include all organisms at that trophic level; no generalisation will be true if only a few individuals are taken into account (page 213).
- A given organism may occupy more than one trophic level at the same time. The trophic level is a functional level, not a species as such: a sparrow is a primary consumer when it eats seeds, fruits and peas, and a secondary consumer when it eats insects and worms (page 213).
- NCERT asks how many trophic levels human beings function at in a food chain (page 213). Eating cereals and vegetables, a person is a primary consumer (second level); eating goat meat, a secondary consumer (third level), as in NCERT’s chain grass → goat → man (page 209); and NCERT Figure 12.2 also places man among the top carnivores at the fourth level (page 210), for example when eating fish, which that figure places at the third level. So humans function at three levels: the second, third and fourth (reasoned from NCERT pages 209, 210 and 213).
Limitations of ecological pyramids
Ecological pyramids have certain limitations (page 214):
- they do not take into account the same species belonging to two or more trophic levels;
- they assume a simple food chain, something that almost never exists in nature; they do not accommodate a food web;
- saprophytes (NCERT’s word here for the decomposers, which it calls saprotrophs on page 210) are given no place in ecological pyramids, even though they play a vital role in the ecosystem.
Solved examples
Example 1: Reading the pyramid of numbers
From NCERT’s grassland pyramid (P 5 842 000, PC 708 000, SC 354 000, TC 3), how many plants are there per top carnivore, and what fraction of the producers’ number are the primary consumers?
Answer: plants per top carnivore = 5 842 000 ÷ 3 ≈ 1 947 333, nearly 2 million. Primary consumers ÷ producers = 708 000 ÷ 5 842 000 ≈ 0.12, about one-eighth (our arithmetic from NCERT Figure 12.4 (a), page 212).
Example 2: The ideal pyramid of energy
In NCERT’s ideal pyramid, what percentage of the sunlight reaches the tertiary consumers, and how much energy is lost between the producers and the primary consumers?
Answer: 10 J of 1 000 000 J = 0.001 per cent reaches the tertiary consumers. Between producers and primary consumers, 10 000 − 1000 = 9000 J is not passed on (lost as heat, or to decomposers) (our arithmetic from NCERT Figure 12.4 (d), page 213).
Example 3: Which pyramid can be inverted?
State whether each can be inverted, with an example: the pyramid of numbers, of biomass and of energy.
Answer: numbers: yes, for insects feeding on a big tree; biomass: yes, in the sea, where a small standing crop of phytoplankton supports a larger standing crop of zooplankton or fishes; energy: never, because some energy is always lost as heat at each step (NCERT pages 212–213).
Common mistakes to avoid
Common mistake
Saying the pyramid of biomass is always upright
In the sea it is generally inverted: the biomass of fishes or zooplankton exceeds that of the phytoplankton (NCERT pages 212–213).
Common mistake
Saying the pyramid of energy can be inverted
It is always upright, because some energy is always lost as heat when it flows to the next level (NCERT page 213).
Common mistake
Treating a trophic level as a species
A trophic level is a functional level: a sparrow is a primary consumer eating seeds and a secondary consumer eating insects (NCERT page 213).
Common mistake
Forgetting the decomposers’ place
Saprophytes have no place in ecological pyramids, although they play a vital role; this is one of the pyramids’ limitations (NCERT page 214).
Quick revision summary
- Ecological pyramids show number, biomass or energy at each trophic level; base: producers (first level); apex: tertiary or top consumers.
- Numbers (grassland): 5 842 000 producers, 708 000 PC, 354 000 SC, 3 TC; inverted at the base for insects on one big tree.
- Biomass (dry weight, NCERT Figure 12.4 (b)): 809, 37, 11, 1.5, a sharp fall; inverted in the sea (phytoplankton 4, zooplankton 21), where a small standing crop supports a larger one.
- Energy: 1 000 000 J sunlight, 10 000 J producers (1 per cent into NPP), 1000, 100, 10 J; always upright, as heat is lost at each step.
- A trophic level is functional: the sparrow is at two levels; humans at the second, third and fourth.
- Limitations: one species at two levels ignored; simple food chain assumed, no food web; saprophytes left out.
Formula sheet
- pyramids: number, biomass, energy
- energy pyramid: always upright
- biomass in the sea: generally inverted
- numbers on one tree: inverted
- ideal model: 1% of sunlight into NPP
- each level: about 10% of the one below
Questions students ask
What is the difference between the pyramids of number, biomass and energy?
The pyramids of number, biomass and energy differ in what they measure at each trophic level: the pyramid of number counts the individuals, the pyramid of biomass weighs the standing crop, the mass of living material at a particular time (NCERT pages 211–212), and the pyramid of energy gives the energy at each level, as in NCERT’s ideal pyramid (NCERT Figure 12.4 (d), page 213). By our reading, they are three measures of the same trophic levels, so one food chain can be drawn as all three: how many organisms, how much living matter and how much energy.
What are the units of a pyramid of energy and a pyramid of biomass?
A pyramid of energy is labelled in units of energy, joules in NCERT’s ideal pyramid (NCERT Figure 12.4 (d), page 213); by our reading, a complete label adds area and time, as in J m yr or kcal m yr, the form of NCERT’s unit for productivity (page 207). A pyramid of biomass is labelled in dry weight per unit area, as in NCERT Figure 12.4 (b), which prints kg m (page 212), dry weight being the more accurate measure of biomass (page 211). A pyramid of numbers gives the number of individuals at each level (NCERT Figure 12.4 (a), page 212), counted in a unit area (page 211), with no mass or energy unit.
How is an ecological pyramid different from a food chain?
A food chain shows who eats whom, while an ecological pyramid shows how much there is at each step: a food chain is a sequence in which an animal feeds on a plant or on another animal and is in turn food for another (NCERT page 209), whereas an ecological pyramid draws one bar for each trophic level, sized by its number, biomass or energy, with the producers at the base (page 212). By our reading, a pyramid can be drawn only after the members of a food chain have been sorted into trophic levels, and it shows quantities, not the feeding links themselves.
Is the pyramid of biomass in a forest upright or inverted?
The pyramid of biomass in a forest is upright, by our reasoning: per square metre, the trunks, branches, leaves and roots of the trees hold far more biomass than all the animals they support, and NCERT says that in most ecosystems producers are more in biomass than the herbivores, and herbivores more than the carnivores (page 213). The reason, as we read it, is that trees store years of their production as wood, so the producers’ standing crop stays far larger than the consumers’.
Practice questions
Try each question first, then open the answer to check your working.
-
Q1. Define ecological pyramids and describe, with examples, pyramids of number and biomass. (NCERT Exercise 8, page 215.)
Show answerHide answer
Ecological pyramids express the food or energy relationship between organisms at successive trophic levels, in terms of number, biomass or energy; the base represents the producers (first trophic level) and the apex the tertiary or top consumers. A pyramid of number counts the individuals at each level: NCERT’s grassland has 5 842 000 producers, 708 000 primary consumers, 354 000 secondary consumers and 3 tertiary consumers (upright), while insects feeding on one big tree give a pyramid inverted at the base. A pyramid of biomass shows the standing crop (dry weight) at each level: 809, 37, 11 and 1.5 (kg m as NCERT labels them; g m in the original study), a sharp fall (upright), while in the sea a small standing crop of phytoplankton (4) supports a larger one of zooplankton (21), so it is inverted (NCERT pages 211–213).
-
Q2. Distinguish between upright and inverted pyramids. (NCERT Exercise 6(c), page 215.)
Show answerHide answer
In an upright pyramid each lower trophic level is larger than the one above it, in number, biomass or energy: producers are more than herbivores, and herbivores more than carnivores, as in most ecosystems. In an inverted pyramid a higher level is larger than the one below it: the pyramid of numbers for insects on a big tree, or the pyramid of biomass in the sea, where zooplankton or fish outweigh the phytoplankton. The pyramid of energy is always upright (NCERT pages 212–213).
-
Q3. Fill in the blank: in an ecosystem dominated by trees, the pyramid (of numbers) is ______ type. (NCERT Exercise 1(b), page 214.)
Show answerHide answer
Inverted: a few large trees support a much larger number of herbivores, such as insects, so the base is narrower than the level above (reasoned from NCERT page 213).