Atomic spectra
NCERT Class 12 Physics Chapter 12 Section 12.3
Quick answer
A dilute excited atomic gas has characteristic emission lines from transitions between bound energy levels. Viewing a brighter continuous source through absorbing gas can reveal dark lines at the same transition wavelengths, provided the lower states are populated; E = hν = hc/λ relates photon energy and wavelength. Real line strengths depend on the populations and conditions, while hot opaque matter usually gives a continuous thermal background.
With your textbook
NCERT Physics Part II (Class 12), Chapter 12 “Atoms”, Section 12.3 “Atomic Spectra”, pages 296–297.
Open the official NCERT chapter (PDF, 2.1 MB, ncert.nic.in) (opens in a new tab)
Checked against the 2026-27 reprint on .
What are atomic spectra?
Atomic spectra
Every element gives out radiation with a spectrum of its own, its characteristic spectrum. When an atomic gas or vapour at low pressure is excited, usually by passing an electric current through it, the radiation contains only certain specific wavelengths: an emission line spectrum (NCERT pages 296–297). In NCERT’s words:
Study of emission line spectra of a material can therefore serve as a type of “fingerprint” for identification of the gas.
NCERT Physics Part II (Class 12), Section 12.3, page 297
When a sufficiently bright continuous source is viewed through the gas, and absorption exceeds the gas’s emission into that sightline, dark lines appear at wavelengths that are in its emission spectrum: the absorption spectrum (NCERT page 297).
Scope: these are bound-to-bound atomic transitions in a dilute gas. Real lines have finite widths, and ions have spectra different from their neutral atoms. A rarefied gas can also emit continua through ionisation/recombination processes; the line-spectrum model isolates its characteristic atomic lines.
In plain words: a glowing gas does not give out every colour, only a few sharp ones, and each element has its own set, like a barcode. View a brighter continuous source through the gas and some of those same colours can go missing, leaving dark lines in the rainbow.
Emission line spectra
- Continuous spectra. Hot, opaque solids, liquids and dense gases typically produce a continuous thermal background, with wavelength-dependent intensity. Interactions and broadening in dense matter contribute to this behaviour (NCERT pages 290–291).
- Line spectra. A rarefied gas heated in a flame, or excited electrically in a glow tube such as a neon sign or a mercury vapour lamp, gives out only certain discrete wavelengths: its spectrum is a series of bright lines. Its atoms are far apart, so the light comes from individual atoms, not from their interactions (NCERT page 291).
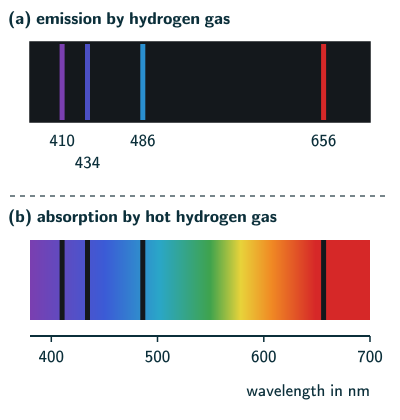
- An emission line spectrum is a set of bright lines on a dark background (NCERT page 297). NCERT Figure 12.5 charts hydrogen’s emission lines from 91 nm in the ultraviolet to 1875 nm in the infrared; four prominent visible lines are highlighted. Each element has its own set; hydrogen, for example, always gives lines with the same relative positions (NCERT page 291). So the lines identify the gas, like a fingerprint (NCERT page 297).
- NCERT notes that this suggested a close link between the internal structure of an atom and its spectrum (NCERT page 291). Rutherford’s nuclear model could not explain why atoms give out only discrete wavelengths (NCERT page 291).
- Hydrogen’s visible lines. In 1885 Balmer found a simple empirical formula for the wavelengths of a group of hydrogen lines (NCERT page 291). In its usual form, with the Rydberg constant R ≈ 1.097 × 10⁷ m−1 and n = 3, 4, 5, … (beyond the NCERT text):
Balmer’s formula (beyond the NCERT text)
- n = 3, 4, 5 and 6 give about 656, 486, 434 and 410 nm, four prominent visible lines. As n grows the lines crowd together towards 4/R ≈ 365 nm, the edge marked in NCERT Figure 12.5 (the formula is beyond the NCERT text).
- Why lines? In Bohr’s model an atom emits a photon of energy hν = Ei − Ef when its electron drops from a higher energy level to a lower one. Only certain levels exist, so only certain frequencies come out (NCERT Section 12.5, pages 300–301).
Absorption spectra
- When a continuous background is viewed through cooler absorbing gas, dark lines can appear in the transmitted spectrum (NASA, Types of Spectra). They lie at exactly the wavelengths found in the emission line spectrum of the gas. This is the absorption spectrum of the gas (NCERT page 297).
- Why: an atom absorbs a photon in a bound-to-bound transition when the photon energy matches, within the line width, the energy its electron needs to jump from a lower energy state to a higher one. So when photons with a continuous range of frequencies pass through a rarefied gas, the frequencies the atoms absorb show up as dark lines (NCERT page 301).
- Atoms may re-emit radiation into other directions, emit a cascade, or lose energy by collisions. An absorption line appears when removal from the observed beam exceeds emission into it (beyond the NCERT text).
- Not every emission line shows up in absorption (reasoned from NCERT page 300). At room temperature nearly all hydrogen atoms are in their lowest energy state, so cool atomic hydrogen absorbs only the lines that start from that state, which lie in the ultraviolet. The visible lines appear in absorption only when some atoms are already in the next state up: in gas at thousands of kelvin, as in the outer layers of stars and in figure (b), or in gas excited by an electric discharge.
- Sunlight (beyond the NCERT text): the solar spectrum has dark lines, the Fraunhofer lines. They include hydrogen’s lines at 656.3 nm and 486.1 nm and sodium’s pair near 589 nm. Their positions identify absorbing species in the solar atmosphere; line strengths also depend on temperature and populations (NASA, The Sun’s Radiation).
Solved examples
Example 1: The red line of hydrogen
Find the energy of a photon of hydrogen’s red line, 656 nm, in joules and in electron volts.
Answer: E = hc/λ = (6.63 × 10−34 × 3 × 108)/
Example 2: A line from a 2.3 eV gap (NCERT Exercise 12.3)
A difference of 2.3 eV separates two energy levels in an atom. What is the frequency of the radiation emitted when the atom goes from the upper level to the lower one?
Answer: ν = ΔE/h = (2.3 × 1.6 × 10−19)/
Example 3: A Balmer line
Use Balmer’s formula with R = 1.097 × 10⁷ m−1 to find the wavelength of the hydrogen line for n = 4.
Answer: 1/λ = 1.097 × 107 × (1/4 − 1/16) = 1.097 × 107 × 0.1875 ≈ 2.06 × 10⁶ m−1, so λ ≈ 486 nm, the blue-green line (beyond the NCERT text).
Example 4: Where the lines end
Towards what wavelength do hydrogen’s Balmer lines crowd as n grows very large?
Answer: As n → ∞, 1/n2 → 0, so 1/λ → R/4 and λ → 4/R = 4/(1.097 × 107) m ≈ 365 nm, just beyond the violet (beyond the NCERT text).
Common mistakes to avoid
Common mistake
Expecting a line spectrum from a hot solid
A glowing solid, liquid or dense gas gives a continuous spectrum; line spectra come from rarefied gases, where the atoms are far apart (NCERT pages 290–291).
Common mistake
Expecting absorption lines at new wavelengths
The dark lines of a gas lie at wavelengths that also appear in its emission spectrum (NCERT page 297).
Common mistake
Mixing up the two spectra
Emission: bright lines on a dark background. Absorption: dark lines on a bright, continuous background (NCERT page 297).
Quick revision summary
- Hot opaque matter typically gives a continuous thermal spectrum; bound-state transitions in rarefied atomic gases give characteristic lines (NCERT pages 290–291).
- Emission line spectrum: bright lines on a dark background, a fingerprint of the element.
- Absorption spectrum: dark lines in white light that has passed through the gas, at wavelengths that are also in its emission spectrum.
- Lines arise because an atom emits or absorbs a photon whose energy hν equals the gap between two of its fixed energy levels.
- Hydrogen’s visible lines, about 656, 486, 434 and 410 nm, follow 1/λ = R(1/2 − 1/n) (beyond the NCERT text).
Formula sheet
- 1/λ = R(1/2 − 1/n)
- E = hν = hc/λ
Questions students ask
What is the difference between an emission spectrum and an absorption spectrum?
An emission spectrum is the light a gas gives out when its excited atoms drop from higher energy levels to lower ones, while an absorption spectrum is what is left of white light after it has passed through the gas, whose atoms remove photons from the beam as they jump up (NCERT pages 297 and 301). Both come from the same energy levels, so each dark absorption line of a gas falls at the wavelength of one of its bright emission lines (NCERT page 297). The reverse need not hold: absorption starts only from levels the atoms already occupy, mostly the lowest, so a cool gas usually shows fewer dark lines than the bright lines it gives when excited (reasoned from NCERT page 300).
Why do atoms give a line spectrum and not a continuous spectrum?
Atoms give a line spectrum because an atom’s energy can take only certain values, and each photon it emits carries away exactly the difference between two of them, hν = Ei − Ef, so only certain frequencies appear (NCERT page 301). The lines are seen when the atoms are far apart, as in a rarefied gas, so that each atom radiates on its own (NCERT page 291). In solids, liquids and dense gases the radiation is governed by each atom’s interaction with its neighbours, and the result is a continuous spread of wavelengths (NCERT pages 290–291).
Why is the line spectrum called the fingerprint of an element?
The line spectrum is called the fingerprint of an element because each element has a line emission spectrum of its own, set by the energy levels of its atoms, so a matching set of measured lines can identify the element and its ionisation state (NCERT Class 11 Chemistry, page 44); NCERT Class 12 Physics says emission line spectra can serve as a type of “fingerprint” for identifying a gas (page 297). It even works across space: helium was discovered in the sun from its spectrum (NCERT Class 11 Chemistry, page 44), through its yellow spectral feature near 587.6 nm in 1868; helium was isolated on Earth in 1895 (beyond the NCERT text; Royal Society of Chemistry, Helium; NIST, Persistent Lines of Neutral Helium).
What is the difference between a line spectrum and a band spectrum?
A line spectrum is a set of sharp, separate lines given out by free atoms, while a band spectrum is made of groups of closely spaced lines that look like bands, given out by molecules (beyond the NCERT text; molecular rotational and vibrational energy-level interpretation). The difference lies in the energy levels: the ordinary optical atomic spectrum mainly reflects electronic levels, whereas a molecule also has vibrational and rotational levels, which adds many closely spaced levels to each electron level, so its transitions crowd together into bands. Hydrogen’s familiar line spectrum therefore comes from atoms, not molecules: the electric discharge first breaks the H2 molecules into excited atoms (NCERT Class 11 Chemistry, page 44).
Practice questions
Try each question first, then open the answer to check your working.
-
Q1. Which gives a line spectrum: the glowing filament of a bulb, or neon gas in a sign?
Show answerHide answer
The neon sign. The hot filament is a solid and gives a continuous spectrum; the rarefied neon gives discrete lines (NCERT pages 290–291).
-
Q2. Find the photon energy, in eV, of hydrogen’s 486 nm line.
Show answerHide answer
E = hc/λ = (6.63 × 10−34 × 3 × 108)/
(486 × 10−9) ≈ 4.09 × 10⁻¹⁹ J ≈ 2.6 eV (reasoned from NCERT Section 11.7, page 283). -
Q3. Sodium vapour gives a bright yellow emission line near 589 nm. Where will the dark line be when white light passes through sodium vapour?
Show answerHide answer
Near 589 nm too: the dark lines of a gas lie at wavelengths found in its emission spectrum (NCERT page 297).