Probability distribution of a random variable
Beyond NCERT In the JEE Main syllabus; the Class 12 book has no section for it.
Quick answer
Beyond the 2026–27 NCERT text, the probability distribution of a discrete random variable X lists each value x that X can take with its probability p = P(X = x); each p is at least 0, and they add up to 1. For the number of heads in three independent fair coin tosses, the values 0, 1, 2 and 3 have probabilities 1/8, 3/8, 3/8 and 1/8. The mean is μ = E(X) = Σ x p and the variance is Var(X) = Σ x p − μ.
What is a probability distribution?
Probability distribution of a random variable
A random variable is a real valued function whose domain is the sample space of a random experiment.
NCERT Mathematics Part II (Class 12), Section 13.5, page 430
- Beyond the NCERT text: the probability distribution of a discrete random variable X lists each value x that X can take, with its probability p = P(X = x); each p ≥ 0, and they add up to 1.
The 2026–27 NCERT book defines a random variable in one remark and goes no further. JEE Main 2027 lists the “probability distribution of a random variable” (Unit 13), so this page takes the next step. Apart from the NCERT lines cited, it is beyond the 2026–27 NCERT text.
In plain words: the values of X come from the outcomes, and p is the total probability of the outcomes that give x.
A probability distribution
p = P(X = x), each p ≥ 0, and p + p + … + p = 1
For three fair coins, the sample space has the eight outcomes HHH, HHT, …, TTT that NCERT uses in Section 13.2 (page 406). Let X be the number of heads.
| x | 0 | 1 | 2 | 3 |
|---|---|---|---|---|
| P(X = x) | 1/8 | 3/8 | 3/8 | 1/8 |
Each outcome counts once: three outcomes (HHT, HTH, THH) give 2 heads. The four probabilities add up to 1, as they must, because every outcome gives exactly one value of X.
NCERT slip (page 406): the chapter’s Introduction says it will teach a random variable and its probability distribution, the mean and variance of a probability distribution, and the Binomial distribution. The 2026–27 chapter ends with Bayes’ theorem (Section 13.5) and defines a random variable only in a remark (pages 430–431). The CBSE 2026–27 Class 12 probability unit ends with Bayes’ theorem; for JEE Main 2027, Unit 13 lists the probability distribution of a random variable, which is this page. The Miscellaneous Exercise still asks one such question (Q4, page 435), and its key (page 457) answers it with the Binomial distribution.
In the coin and dice examples, assume fair coins, unbiased dice and independent tosses or rolls unless stated otherwise. Card and ball draws are uniformly random from the available objects.
Building a distribution
To find the distribution of X:
- List the outcomes of the experiment, equally likely if possible.
- Find the value of X for each outcome.
- For each value x, add the probabilities of the outcomes that give it.
- Check that the probabilities add up to 1.
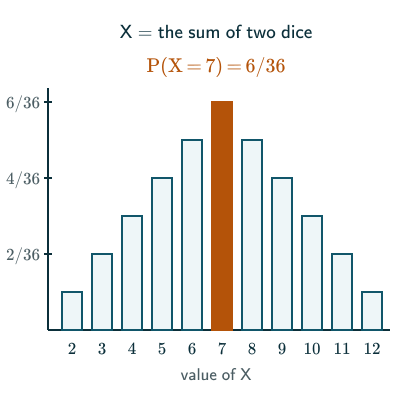
For the sum of two dice, the 36 outcomes give the values 2 to 12, and the number of ways to get x is 6 − |x − 7|. The middle value is the most likely.
Mean and variance
The mean (or expectation) of X weights each value by its probability. The variance measures the spread about the mean, and its square root is the standard deviation. They work like the Class 11 variance of a frequency distribution, with probabilities in place of relative frequencies.
Mean and variance
μ = E(X) = xp + xp + … + xp
Var(X) = Σ (x − μ) p = Σ x p − μ
For the number of heads in three tosses, μ = 0 × 1/8 + 1 × 3/8 + 2 × 3/8 + 3 × 1/8 = 3/2. Also Σ x p = (0 + 3 + 12 + 9)/8 = 3, so Var(X) = 3 − 9/4 = 3/4. For the sum of two dice, μ = 7 and Var(X) = 35/6.
The mean need not be a value X can take: no toss of three coins gives 3/2 heads. It is the long-run average.
Solved examples
Example 1: Find the constant
X takes the values 1, 2, 3 and 4 with P(X = x) = kx. Find k, P(X ≥ 3) and the mean.
The probabilities add up to 1: k(1 + 2 + 3 + 4) = 10k = 1.
Answer: k = 1/10, P(X ≥ 3) = 3/10 + 4/10 = 7/10, and μ = (1 + 4 + 9 + 16)/10 = 3.
Example 2: Aces in two cards
Two cards are drawn without replacement from a pack of 52. Find the distribution of X, the number of aces, and its mean.
There are 1326 pairs: 1128 have no ace, 4 × 48 = 192 have one, and 6 have two.
Answer: P(X = 0) = 188/221, P(X = 1) = 32/221 and P(X = 2) = 1/221, which add up to 1. The mean is (32 + 2)/221 = 2/13.
Example 3: Galileo’s dice (NCERT Historical Note, page 438)
NCERT records that Galileo found a sum of 10 more likely than a sum of 9 when three dice are thrown. Check this, with X the sum of the three dice.
Both sums can be split into three dice values in six ways, which seems to make them equal. But the 216 ordered outcomes are the equally likely ones: 27 give 10 and 25 give 9.
Answer: P(X = 10) = 27/216 = 1/8 and P(X = 9) = 25/216, so 10 is more likely.
Example 4: Sixes in two throws
A die is thrown twice. Find the distribution of X, the number of sixes, and its mean and variance.
No six: (5/6)2 = 25/36; one six: 2 × (1/6)(5/6) = 10/36; two sixes: 1/36.
Answer: μ = 10/36 + 2/36 = 1/3, and Var(X) = (10 + 4)/36 − 1/9 = 5/18.
Common mistakes to avoid
Common mistake
A table that is not a distribution
Every probability must be at least 0 and they must add up to 1. Values 0.4, 0.4 and 0.3 add up to 1.1, so they cannot be a distribution.
Common mistake
Counting unordered outcomes
Splittings of a sum such as 9 = 3 + 3 + 3 are not equally likely: 3 + 3 + 3 happens one way, but 1 + 2 + 6 happens six ways. Count ordered outcomes, as in Example 3.
Common mistake
Forgetting the square of the mean
Var(X) = Σ x p − μ. Leaving out μ gives Σ x p, which is the mean of X, not the variance.
Quick revision summary
- A random variable X is a real valued function on the sample space.
- For a discrete random variable, its probability distribution lists each value x with p = P(X = x); each p ≥ 0, and they add up to 1.
- Mean: μ = E(X) = Σ x p. Variance: Var(X) = Σ x p − μ.
Formula sheet
- p = P(X = x), p ≥ 0, p + … + p = 1
- μ = E(X) = Σ x p
- Var(X) = Σ (x − μ) p
Questions students ask
Is the probability distribution of a random variable in NCERT Class 12 and the JEE Main syllabus?
The probability distribution of a random variable is in the JEE Main 2027 syllabus but not in the 2026–27 NCERT book, whose Chapter 13 only defines a random variable (Remark, pages 430–431). Unit 13 lists probabilities of events, addition and multiplication theorems, Bayes’ theorem and the probability distribution of a random variable. NCERT’s Introduction (page 406) still promises distributions, their mean and variance, and the Binomial distribution, but the chapter ends with Bayes’ theorem. The syllabus names neither the Binomial distribution nor a random variable’s mean and variance, which, like distribution tables, are beyond the NCERT text.
Why is a random variable called a variable when it is a function?
Beyond the NCERT text (reasoned), a random variable is called a variable because its value varies from trial to trial and is not known until the experiment is done, although NCERT defines it as “a real valued function whose domain is the sample space of a random experiment” (Remark, page 430): the rule is fixed, and the randomness lies in the outcome that it is applied to. For one card from a pack of 52, the rule “X = 1 for an ace and X = 0 for any other card” is completely definite, yet the value of X on the next draw is uncertain. Its probability distribution, also beyond the NCERT text, is P(X = 1) = 1/13 and P(X = 0) = 12/13.
What is the difference between a random variable and its probability distribution?
Beyond the NCERT text (reasoned), a random variable X, which NCERT’s Remark (page 430) defines as a real valued function on the sample space, is the rule giving a number for each outcome, while its probability distribution lists only the values X can take with their probabilities, not which outcome gave which value. Two different random variables can therefore have the same distribution: for two dice, X = the number on the first die and Y = the number on the second each take the values 1 to 6 with probability 1/6, yet X = Y only on the 6 doubles. The distribution of X settles P(X = x), the mean and the variance, but not questions that combine two variables, such as X + Y.
What is the difference between discrete and continuous random variables?
Beyond the NCERT text, a discrete random variable has a finite or countably infinite list of possible values with probabilities that sum to 1. This page uses finite lists, so its mean and variance are finite sums. In the continuous models described by a probability density, such as a uniform value on [0, 1], a single exact value has probability 0 and interval probabilities are integrals of the density. Such models need not have every value in one interval as possible values: their support can have gaps. A table assigning a probability to each separate value describes a discrete distribution, not a density.
What is the difference between a probability distribution and a frequency distribution?
A frequency distribution records actual data, how many times each value occurred in a set of trials, as in Class 11 statistics, while a probability distribution, beyond the NCERT text, gives the theoretical chance of each value before any trial is made: one is observed, the other is a model. Dividing each frequency by the total gives relative frequencies, and for independent repetitions of the same experiment, these proportions approach the model probabilities in the long run (the law of large numbers); they need not be exact after any finite number of trials. If a coin gives 28 heads in 50 tosses, the relative frequency of a head is 28/50 = 0.56, while the probability in a fair-coin model is 1/2.
Practice questions
Try each question first, then open the answer to check your working.
-
Q1. Which of these can be a probability distribution: (i) 0.3, 0.5, 0.3; (ii) 0.6, −0.1, 0.5; (iii) 0.2, 0.5, 0.3?
Show answerHide answer
Only (iii). (i) adds up to 1.1, and (ii) has a negative probability.
-
Q2. Two coins are tossed, and Y = number of heads − number of tails (NCERT’s second example, page 431). Find the distribution of Y and its mean.
Show answerHide answer
P(Y = −2) = 1/4, P(Y = 0) = 1/2 and P(Y = 2) = 1/4; the mean is −2/4 + 0 + 2/4 = 0.
-
Q3. P(X = x) = kx2 for x = 1, 2, 3. Find k and P(X = 3).
Show answerHide answer
k(1 + 4 + 9) = 1, so k = 1/14, and P(X = 3) = 9/14.
-
Q4. Find the mean and variance of the score on one throw of a fair die.
Show answerHide answer
μ = 21/6 = 7/2. Σ x2/6 = 91/6, so Var(X) = 91/6 − 49/4 = 35/12.